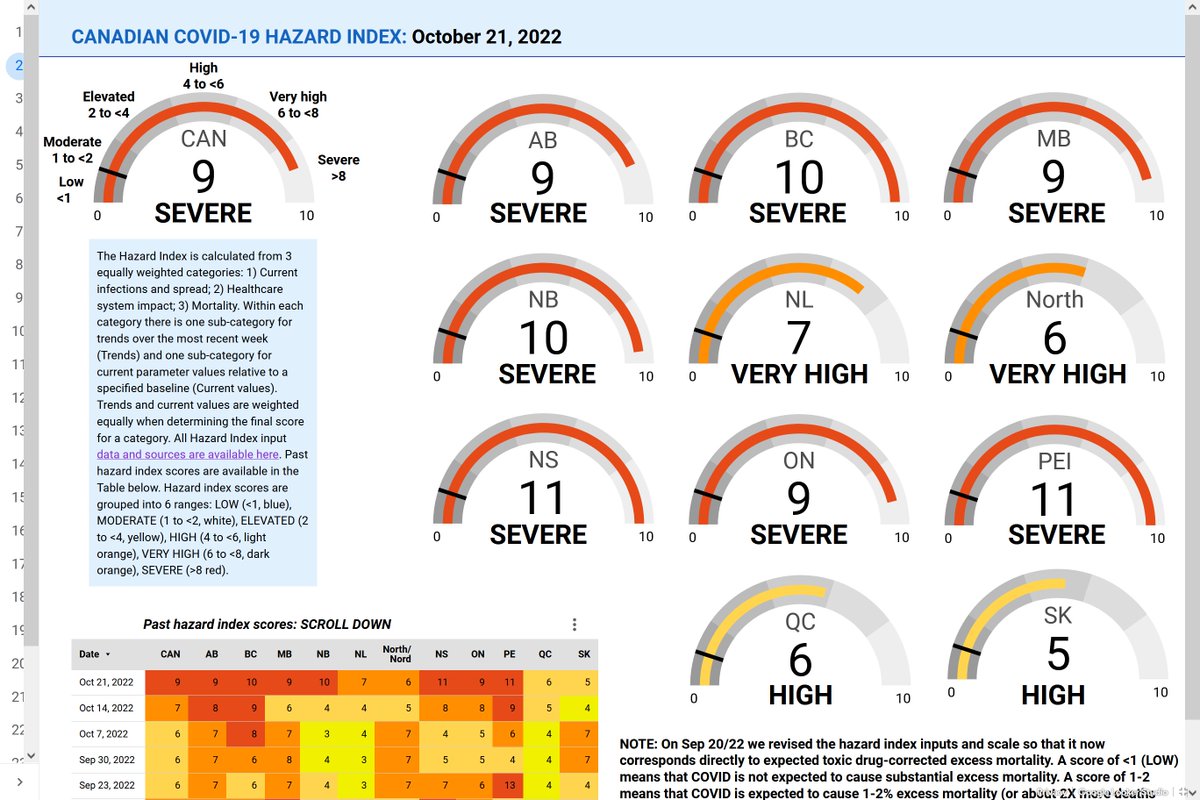
Oct 21 Canadian COVID Hazard Index and associated data are now live
SEVERE: CAN, AB, BC, MB, NB, NS, ON, PEI
VERY HIGH: NL, NWT, NUV, YK
HIGH: QC, SK
All regions are increasing
1 in every 36 people are infected
Time to mask, boost, test is NOW
Link: covid19resources.ca/covid-hazard-i…
SEVERE: CAN, AB, BC, MB, NB, NS, ON, PEI
VERY HIGH: NL, NWT, NUV, YK
HIGH: QC, SK
All regions are increasing
1 in every 36 people are infected
Time to mask, boost, test is NOW
Link: covid19resources.ca/covid-hazard-i…

@picardonhealth @twpiggott @mustafahirji @RajBhardwajMD @JillianHortonMD @LabradorIce @AntibioticDoc @CPHO_Canada @KrishanaSankar @LisaBarrettID I'm not providing individual estimates for the number of people infected in each province this week. The situation is too volatile.
You should assume where you live is similar or possibly higher than the national average of 1 in 36 infected.
You should assume where you live is similar or possibly higher than the national average of 1 in 36 infected.
@picardonhealth @twpiggott @mustafahirji @RajBhardwajMD @JillianHortonMD @LabradorIce @AntibioticDoc @CPHO_Canada @KrishanaSankar @LisaBarrettID A major concern is how fast estimated first time infections are increasing.
Estimated new daily first time infections are now higher than in any Omicron wave except BA.1.
Most are likely people 40+ who haven't had recent new dose and no longer have vax protection vs infection.
Estimated new daily first time infections are now higher than in any Omicron wave except BA.1.
Most are likely people 40+ who haven't had recent new dose and no longer have vax protection vs infection.

@picardonhealth @twpiggott @mustafahirji @RajBhardwajMD @JillianHortonMD @LabradorIce @AntibioticDoc @CPHO_Canada @KrishanaSankar @LisaBarrettID You can really seen the climbing infections in people of all ages but especially 80+ in the chart here.
To plot all age groups on the same graph, we express new weekly hospitalizations as fold over expected weekly flu hospitalizations in same age group (ignoring flu seasonality)
To plot all age groups on the same graph, we express new weekly hospitalizations as fold over expected weekly flu hospitalizations in same age group (ignoring flu seasonality)

@picardonhealth @twpiggott @mustafahirji @RajBhardwajMD @JillianHortonMD @LabradorIce @AntibioticDoc @CPHO_Canada @KrishanaSankar @LisaBarrettID The chart shows 12-wk right-aligned rolling avgs.
We need to do this to better see trends amidst noise from reporting delays, monthly age-specific severe outcome data PHAC data dumps etc.
Hospitalizations are increasing across all age groups.
The time for your next dose is NOW
We need to do this to better see trends amidst noise from reporting delays, monthly age-specific severe outcome data PHAC data dumps etc.
Hospitalizations are increasing across all age groups.
The time for your next dose is NOW

@picardonhealth @twpiggott @mustafahirji @RajBhardwajMD @JillianHortonMD @LabradorIce @AntibioticDoc @CPHO_Canada @KrishanaSankar @LisaBarrettID What I'm increasingly concerned about is the possibility that we may also be seeing a lot of reinfections right now...of people infected in the massive BA.1 wave.
@sarperotto has been talking about how this can drive a new wave in Canada even without new variants.
@sarperotto has been talking about how this can drive a new wave in Canada even without new variants.
@picardonhealth @twpiggott @mustafahirji @RajBhardwajMD @JillianHortonMD @LabradorIce @AntibioticDoc @CPHO_Canada @KrishanaSankar @LisaBarrettID @sarperotto Variant sequencing is slow in Canada--we don't know yet if the big surge in waste water we're seeing in almost every Canadian region now reflects the spread of a new variant, or "echo" reinfections of people infected in the BA.1 wave.
cc @DGBassani re incoming variants
cc @DGBassani re incoming variants
@picardonhealth @twpiggott @mustafahirji @RajBhardwajMD @JillianHortonMD @LabradorIce @AntibioticDoc @CPHO_Canada @KrishanaSankar @LisaBarrettID @sarperotto @DGBassani I can't do a longer thread now because I have to run to a meeting, but really wanted to get this out before people switch into weekend mode.
@picardonhealth @twpiggott @mustafahirji @RajBhardwajMD @JillianHortonMD @LabradorIce @AntibioticDoc @CPHO_Canada @KrishanaSankar @LisaBarrettID @sarperotto @DGBassani If you're high risk, now is the time to avoid indoor settings with others when/if you can, in addition to all other precautions.
If you're not high risk, please also consider masking, limiting high risk indoor activities, testing, getting your next dose to help slow down spread.
If you're not high risk, please also consider masking, limiting high risk indoor activities, testing, getting your next dose to help slow down spread.
@picardonhealth @twpiggott @mustafahirji @RajBhardwajMD @JillianHortonMD @LabradorIce @AntibioticDoc @CPHO_Canada @KrishanaSankar @LisaBarrettID @sarperotto @DGBassani You matter. Your loved ones and community matter.
We've protected each other successfully before.
It's time to resume/renew all the usual precautions to help yourself, each other and our healthcare system.
Love to all.
#TogetherWeCan
Still.
We've protected each other successfully before.
It's time to resume/renew all the usual precautions to help yourself, each other and our healthcare system.
Love to all.
#TogetherWeCan
Still.
Oops. I forgot.
If you want to discuss these data, your next vaccine dose, masking--anything COVID-related, you can find me, other volunteers and a wonderful community of people from across the country at our free, anonymous Zoom sessions.
Link: covid19resources.ca/discussions/
If you want to discuss these data, your next vaccine dose, masking--anything COVID-related, you can find me, other volunteers and a wonderful community of people from across the country at our free, anonymous Zoom sessions.
Link: covid19resources.ca/discussions/
Finally, I forgot to provide context for what the Hazard Index score means.
If the score is 9, about 9 times more people are expected to die from COVID infections this week than people who die weekly from flu in Canada (ignoring flu seasonality).
It's ~9% excess mortality.
If the score is 9, about 9 times more people are expected to die from COVID infections this week than people who die weekly from flu in Canada (ignoring flu seasonality).
It's ~9% excess mortality.
Average Canadian excess mortality for COVID epidemic to date is 7%.
It's likely we'll see ~30% more severe outcomes from infections this week than weekly average for Canadian epidemic to date, including pre-vax and Delta times.
It's likely we'll see ~30% more severe outcomes from infections this week than weekly average for Canadian epidemic to date, including pre-vax and Delta times.

Based on data released by @StatCan_eng this week, we expect that about 112,000 people living in Canada contracted infections this week that will lead to at least one symptom lasting at least 3 months.
Please, please protect yourselves and others. No one needs this.
Please, please protect yourselves and others. No one needs this.
And wear a good, N95-type mask.
If you can't afford them, you can request free high quality masks from @DonateMask here: donatemask.ca
If you can afford good masks, please consider donating or buying from this charity. They use profits to fund mask donations.
If you can't afford them, you can request free high quality masks from @DonateMask here: donatemask.ca
If you can afford good masks, please consider donating or buying from this charity. They use profits to fund mask donations.
• • •
Missing some Tweet in this thread? You can try to
force a refresh


