The only certainty for European natural gas prices going forward is volatility, volatility and more volatility.
Here is why...
1/n #LNG #TTF
Here is why...
1/n #LNG #TTF

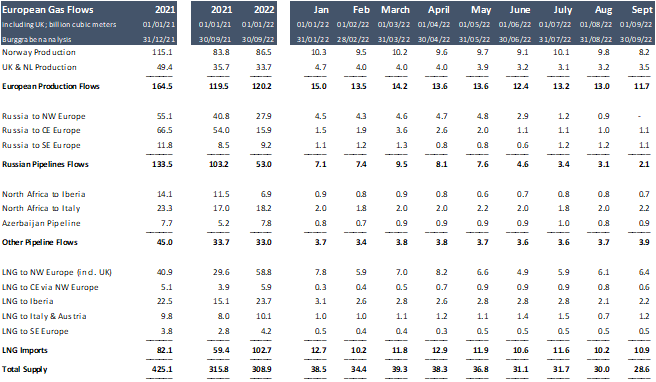
The Great Rotation: With the invastion of Ukraine, VVP decided to use gas as a weapon & cut pipeline flows into Europe.
In return, Europe maxed out LNG terminal capacities & contracted every available free LNG cargo globally to compensate the collapse of Russian flows.
2/n
In return, Europe maxed out LNG terminal capacities & contracted every available free LNG cargo globally to compensate the collapse of Russian flows.
2/n
Europe was able to attract LNG by being the best business globally.
How? By offering the highest prices. A cargo owner such as Trafigura or Total which bought LNG at Cheniere in US for $4.1/MMBtu + $3 gasification fee in Jan 2022 booked a pre-shipping profit of $21/MMBtu.
3/n
How? By offering the highest prices. A cargo owner such as Trafigura or Total which bought LNG at Cheniere in US for $4.1/MMBtu + $3 gasification fee in Jan 2022 booked a pre-shipping profit of $21/MMBtu.
3/n

It however gets more complicated.
First, as with for all commodities, natural gas prices have the function to match demand and supply daily to accomodate the commodity's specific logistics as natgas can only be consumed or stored.
4/n
First, as with for all commodities, natural gas prices have the function to match demand and supply daily to accomodate the commodity's specific logistics as natgas can only be consumed or stored.
4/n
https://twitter.com/BurggrabenH/status/1582877621997563904?s=20&t=AQ49npEnoA2AtLGce6sS9w
That means that Europe's LNG import terminal buyers are free to discount a cargo owner's price to TTF, Europe's gas hub price.
They must: storages in the UK, ESP, FRA or ITA (major regasification hubs) are now 100%, 93%, 99% & 95%-filled, respectively.
5/n ESP %-filled
They must: storages in the UK, ESP, FRA or ITA (major regasification hubs) are now 100%, 93%, 99% & 95%-filled, respectively.
5/n ESP %-filled

Here is one (of many) mismatches of European gas infrastructure from the "big rotation".
Neither the UK or ESP have enough storage to accomodate their regas terminal capacities.
In addition, ESP is pipeline export constraint into France (MidCat pipeline project pending).
6/n
Neither the UK or ESP have enough storage to accomodate their regas terminal capacities.
In addition, ESP is pipeline export constraint into France (MidCat pipeline project pending).
6/n

Consequently, TTF/NBP are down hard (& in s-term cantongo) & LNG trades at a discount to TTF.
Means? A Nov cargo into Spain was heard trading at TTF minus $30/MMBtu. Call it a "regas terminal slot discount".
For now, the stop-loss is Far East minus shipping cost.
7/n
Means? A Nov cargo into Spain was heard trading at TTF minus $30/MMBtu. Call it a "regas terminal slot discount".
For now, the stop-loss is Far East minus shipping cost.
7/n

However, cargo owners (and TTF) know winter is around the corner. At that point Europe's consumption is 2-4x higher than now.
Hence, they prefer to float their tankers and sell into higher Dec TTF prices which are currently at $42/MMBtu (3rd bullett from left).
8/n
Hence, they prefer to float their tankers and sell into higher Dec TTF prices which are currently at $42/MMBtu (3rd bullett from left).
8/n

Consequently, LNG floating storage is going vertical (below; Mt).
9/n
9/n

This in turn removes LNG shipping capacities globally and, among others, sent LNG shipping spot rates to $375,000 per day - an all time record.
10/n
10/n

TTF $10/MMBtu lower for Oct/Nov, LNG cargo discounts of $15/MMBtu & higher shipping rates (true for East of Suez rates too) will reduce LNG flows into Europe to match storage availability.
Message: Politicians don't need a price cap. Floating prices do the work instead.
11/n
Message: Politicians don't need a price cap. Floating prices do the work instead.
11/n
What EU politicians however need to do if they are serious about reducing prices is to create a 50-70mt LNG export capex boom.
That in turn needs l-t contracts as terminal capacity expansion needs $bn for which Qatar et al must sell cargo for 20 years to earn it back.
12/n
That in turn needs l-t contracts as terminal capacity expansion needs $bn for which Qatar et al must sell cargo for 20 years to earn it back.
12/n
Sadly, l-t contracts are in conflict with European climate laws which require the industry to be net-zero by 2050.
Why would EU utilities, majors or trading houses sign l-t LNG contracts with Qatar on that basis?
Answer: they don't.
13/n @OKalleklev
smartermarketspod.com/winter-is-comi…
Why would EU utilities, majors or trading houses sign l-t LNG contracts with Qatar on that basis?
Answer: they don't.
13/n @OKalleklev
smartermarketspod.com/winter-is-comi…
That means EU gas markets depend on the LNG spot market as opposed to the LNG contract market.
LNG spot prices however will always be a game of regional temps (Asia; EU), infra availability or seasonality and hence price extremes.
Volatility is a certainty for years.
14/ thx
LNG spot prices however will always be a game of regional temps (Asia; EU), infra availability or seasonality and hence price extremes.
Volatility is a certainty for years.
14/ thx
• • •
Missing some Tweet in this thread? You can try to
force a refresh