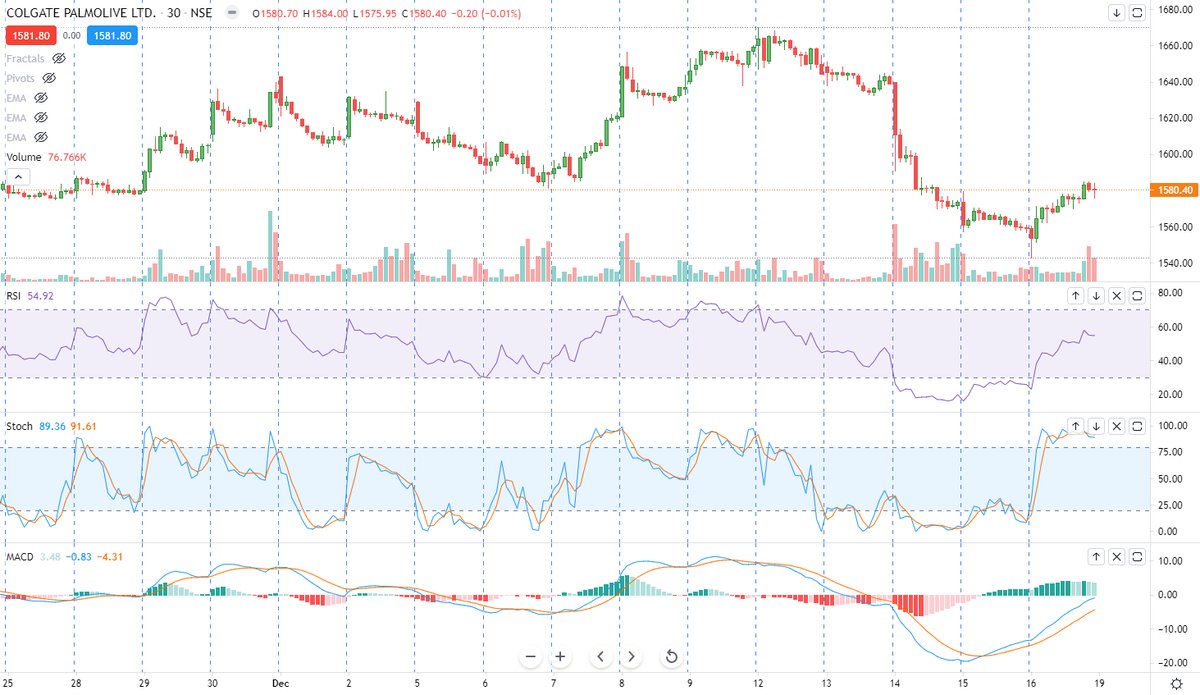
Master Class on ⭕️How to use CPR Indicator⭕️
🧵
You will learn the following application of CPR
- Use to plot Support/Resistance
- Identify Trending, volatile and sideways market
- Correctly identify the market trend
🔖bookmark to save
@kuttrapali26 @KommawarSwapnil @bhatiamanu
🧵
You will learn the following application of CPR
- Use to plot Support/Resistance
- Identify Trending, volatile and sideways market
- Correctly identify the market trend
🔖bookmark to save
@kuttrapali26 @KommawarSwapnil @bhatiamanu
Building blocks of Central Pivot Range (CPR)
🟢How to apply CPR
1⃣ Open #TradingView website
2⃣ apply CPR with pivot levels - CPR by KGS
3⃣ Keep on Daily pivot, Daily BC and Daily TC checked
🟢How to apply CPR
1⃣ Open #TradingView website
2⃣ apply CPR with pivot levels - CPR by KGS
3⃣ Keep on Daily pivot, Daily BC and Daily TC checked

Using CPR to identify the type of markets
1⃣ CPR with narrow range = Trending markets
2⃣ CPR with wide range = Sideways or volatile
3⃣ CPR with medium range = Trending or sideways
Remember to use them on 5 min time frame and This holds a good accuracy of 80%


1⃣ CPR with narrow range = Trending markets
2⃣ CPR with wide range = Sideways or volatile
3⃣ CPR with medium range = Trending or sideways
Remember to use them on 5 min time frame and This holds a good accuracy of 80%


Using Virgin CPR to plot strong Support/Resistance.
🟢Identify a CPR in which price opens above and never touched any CPR level in the entire day
🟢Extend the CPR line to right to plot support zone
🟢To find Resistance zone find CPR with price opening below it and extend that CPR
🟢Identify a CPR in which price opens above and never touched any CPR level in the entire day
🟢Extend the CPR line to right to plot support zone
🟢To find Resistance zone find CPR with price opening below it and extend that CPR

Identify the trend clearly
🟢Don't just short the market if the price closed below the CPR level
🟢Always look the main trend by looking at the relative position of CPR
🟢Rising CPR levels = uptrend
🟢Falling CPR levels = Downtrend
🟢Don't just short the market if the price closed below the CPR level
🟢Always look the main trend by looking at the relative position of CPR
🟢Rising CPR levels = uptrend
🟢Falling CPR levels = Downtrend

😇On the journey to share 100 educational threads.
The goal is to educate people about markets one thread at a time.
👥checkout time of @AakashSSawant1
for previous educational threads which have received more than 1 lakh impressions 😇
🐦Re-tweet to share
The goal is to educate people about markets one thread at a time.
👥checkout time of @AakashSSawant1
for previous educational threads which have received more than 1 lakh impressions 😇
🐦Re-tweet to share
• • •
Missing some Tweet in this thread? You can try to
force a refresh


