For the first time, we’ve collected #Census2021 information on the veteran population.

1,853,112 people in England and Wales said they had previously served in the UK armed forces (3.8% of usual residents aged 16 years and over).

➡️ ow.ly/SGlG50LzB0n 1 in 25 people aged 16 years and over in England and Wales w
Of the UK armed forces veterans in England and Wales:

▪️ 1.4 million people previously served in the regular forces
▪️ 361,000 people in the reserve forces
▪️ 79,000 people served in both the regular and reserve forces Rotated bar chart showing almost 1 in 25 people aged 16 year
Just over 1.8 million (98.0%) veterans lived in households, while 37,000 (2.0%) lived in communal establishments.

This is similar to the population as a whole - 98.3% of usual residents in England and Wales live in households and 1.7% live in communal establishments.
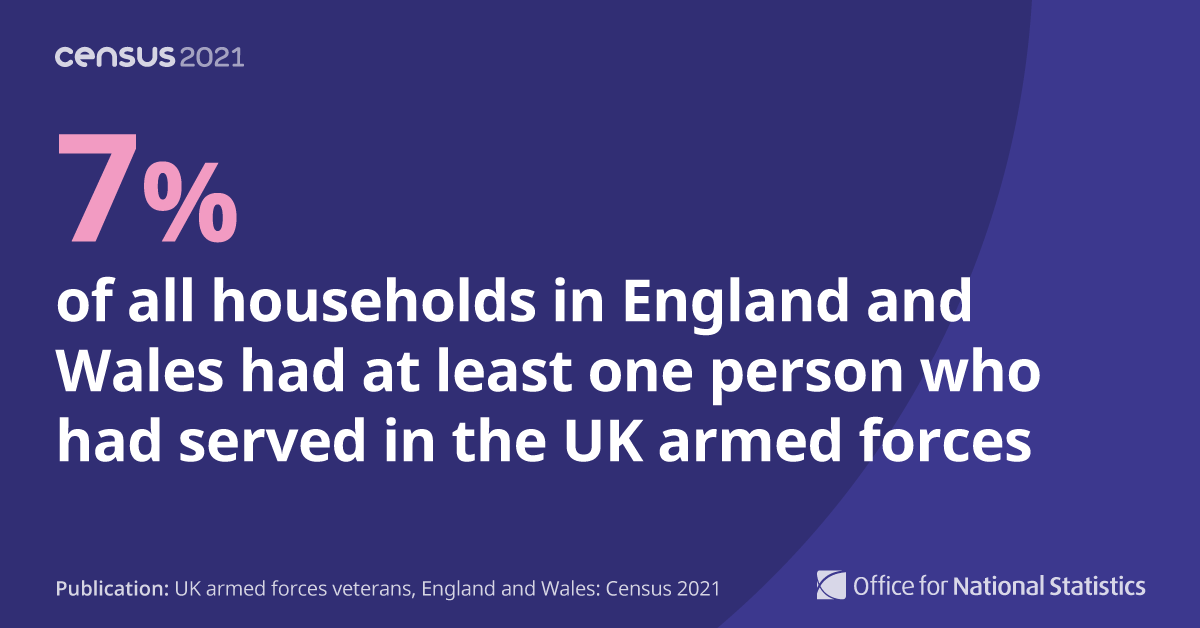
1.7 million households (7.0%) in England and Wales had at least one person who had previously served in the UK armed forces.

Of these households:

▪️ 96% included only one veteran
▪️ 3.9% included two veterans
▪️ 0.1% had three or more veterans 7% of all households in England and Wales had at least one p
The proportion of UK armed forces veterans (aged 16 years and over) was higher in Wales (4.5% of the population, 115,000) than it was in England (3.8%, 1.7 million). Rotated bar chart showing proportion of UK armed forces vete
Correction: In England, the regions with the highest proportion of veterans are:

▪️ South West (5.6%, 265,000 people)
▪️ North East (5.0%, 109,000 people)

London had the lowest proportion of UK armed forces veterans (1.4%, 101,000 people).

➡️ ow.ly/rVse50LAXtp

• • •

Missing some Tweet in this thread? You can try to force a refresh
 

Keep Current with Office for National Statistics (ONS)

Office for National Statistics (ONS) Profile picture

Stay in touch and get notified when new unrolls are available from this author!

Read all threads

This Thread may be Removed Anytime!

PDF

Twitter may remove this content at anytime! Save it as PDF for later use!

Try unrolling a thread yourself!

how to unroll video
  1. Follow @ThreadReaderApp to mention us!

  2. From a Twitter thread mention us with a keyword "unroll"
@threadreaderapp unroll

Practice here first or read more on our help page!

More from @ONS

Nov 11
We’ve published new climate change insights covering natural and rural environments 🌍

The 21st century so far has been warmer overall than any period of equivalent length in the previous three centuries 🌡

➡️ ow.ly/E8Nf50LAQ3o Line chart showing seasonal...
.@metoffice report 2022 averages compared with those from 1991 to 2020:

🍁 autumn (so far): 0.5°C above average with 11% more rain
🌷 spring: 1.1°C above with 38% less rain
☀️ summer: 0.8°C above with 24% less rain
❄️ winter (21/22): 1.1°C above with 7% less rain
Between 1980 and 2017, pollinators (377 species including bees and hoverflies) had declined by 30% in their distribution across the UK 🐝📉
Read 4 tweets
Nov 11
We've published our latest Public opinions and social trends article (26 Oct to 6 Nov 2022) with insights on daily life and the #CostOfLiving

New insights include:
▪️ important issues facing the UK today
▪️ people keeping warm in their home

➡️ ow.ly/n33U50LAPnn Public opinions and social ...
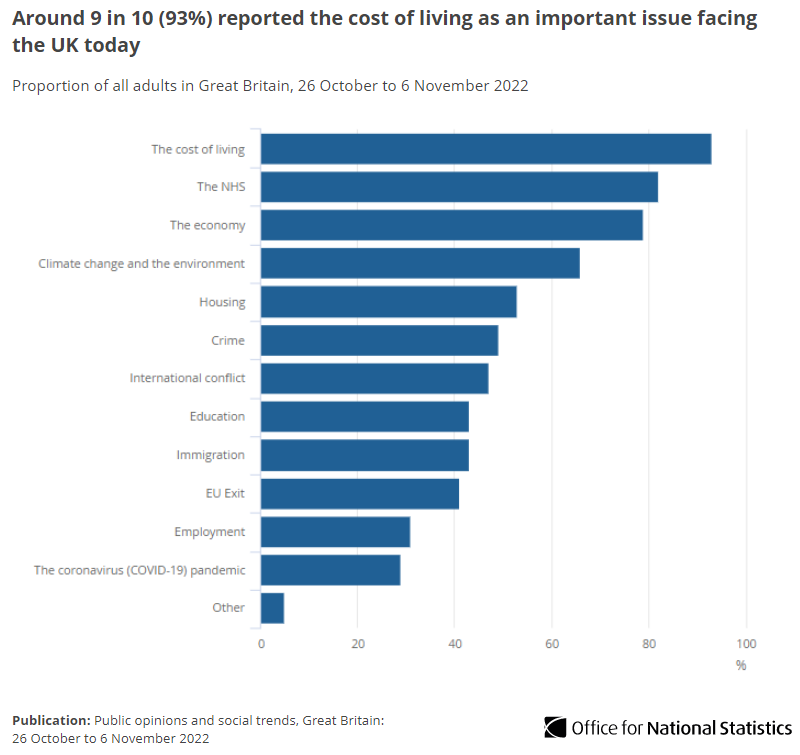
When asked about the important issues facing the UK today 93% of adults said the cost of living was an important issue📈

Other issues reported as important were:

🏥 NHS (82%)
💷 economy (79%)
🌍 environment and climate change (66%) Rotated bar chart showing  ...
91% reported their cost of living had increased compared to a year ago, while 77% reported an increase in their cost of living compared to one month ago. 9 in 10 adults reported the...
Read 7 tweets
Nov 11
GDP fell 0.2% in Quarter 3 (July to September) 2022 with:

▪️ services flat (0.0% growth)
▪️ manufacturing falling 2.3%
▪️ construction growing 0.6%

➡️ ow.ly/8WHv50LAKqe Graphic with text: GDP fell...
GDP fell 0.6% in September, after a revised fall of 0.1% in August 📉

This was driven by a fall in consumer-facing industries, which were affected by the additional bank holiday for the State Funeral of Her Majesty Queen Elizabeth.

➡️ ow.ly/maOA50LAKsz Output in consumer-facing s...
Commenting on today’s GDP figures, Director of Economic Statistics Darren Morgan said: (1/2)

⬇️ Commenting on today’s GDP f...
Read 5 tweets
Nov 10
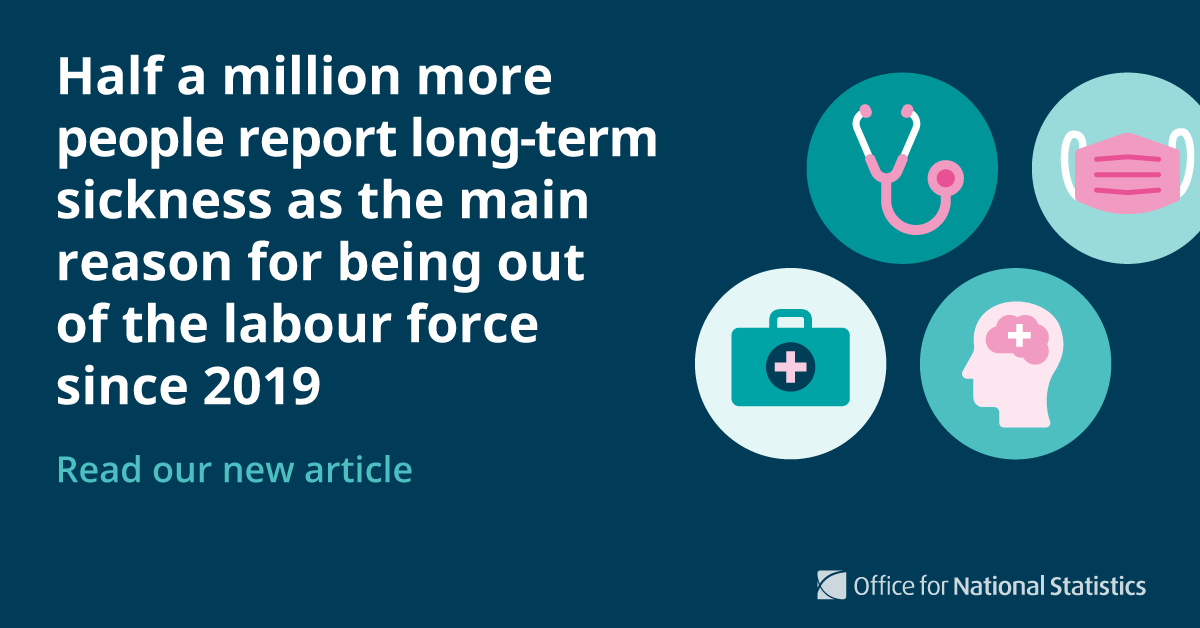
Since 2019, the number of people out of the labour market (economically inactive) because of long-term sickness has risen by almost half a million 📈

Our latest article explores the possible drivers behind this recent increase, and who it is affecting ➡️ ow.ly/wSXP50LzEuA Half a million more people report long-term sickness as the
Around 2.5 million people were economically inactive because of long-term sickness in summer 2022 – compared with around 2 million people in spring 2019.

Since the #COVID19 pandemic hit the UK, the number of people out of work because of long-term sickness has risen by 363,000. Line chart showing the number of people out of the labour ma
Those inactive because of long-term sickness with “other health problems or disabilities” rose 41% between 2019 and 2022, the largest of any category.

The second largest increase over the same time period was for "problems connected with neck or back", with a 31% increase. A series of line charts showing “Other” health problems
Read 7 tweets
Nov 10
We’ve released economic activity and social change data.

The System Average Price of gas rose by 110% in the week to 6 Nov 2022, according to @NationalGridUK 🔥

This is 322% above Feb 2020’s pre-#COVID19 baseline level, but 79% below Aug 2022’s peak.

➡️ ow.ly/K50350LzCGp Line chart showing the System Average Price (SAP) of gas ros
The overall weekly retail footfall in the week to 6 Nov 2022 was:

▪️ 91% of the previous week
▪️ 88% of the equivalent week of 2019

These figures are from @Springboard_. Line chart showing in the week to 6 November 2022, overall w
@bankofengland’s aggregate CHAPS-based indicator of credit and debit card purchases increased by 6 percentage points in the week to 3 Nov 2022 💳

This is in line with previous end-of-month and seasonal spending patterns. Line chart showing the aggregate CHAPS-based indicator of cr
Read 4 tweets
Nov 10
Am y tro cyntaf, rydyn ni wedi casglu gwybodaeth #Cyfrifiad2021 am y boblogaeth cyn-filwyr.

Dywedodd 1,853,112 o bobl yng Nghymru a Lloegr eu bod wedi gwasanaethu yn lluoedd arfog y DU yn y gorffennol (3.8% o breswylwyr arferol dros 16 oed).

➡️ ow.ly/Uo7Q50LzC5K
Roedd gan 7% (1.7 miliwn) o'r holl gartrefi yng Nghymru a Lloegr o leiaf un person a oedd wedi gwasanaethu yn lluoedd arfog y DU.

O blith y cartrefi hyn:

▪️ roedd 96% yn cynnwys 1 cyn-filwr yn unig
▪️ roedd 3.9% yn cynnwys 2 gyn-filwr
▪️ roedd gan 0.1% 3 chyn-filwr neu fwy
Yng Nghymru, yr awdurdodau lleol â'r gyfran uchaf o gyn-filwyr oedd:

▪️ Conwy (5.9%)
▪️ Sir Benfro (5.7%)

Yr awdurdodau lleol â'r gyfran uchaf o gartrefi ag o leiaf un cyn-filwr oedd:

▪️ Conwy (10.2%)
▪️ Ynys Môn (9.9%)
Read 4 tweets

Did Thread Reader help you today?

Support us! We are indie developers!


This site is made by just two indie developers on a laptop doing marketing, support and development! Read more about the story.

Become a Premium Member ($3/month or $30/year) and get exclusive features!

Become Premium

Don't want to be a Premium member but still want to support us?

Make a small donation by buying us coffee ($5) or help with server cost ($10)

Donate via Paypal

Or Donate anonymously using crypto!

Ethereum

0xfe58350B80634f60Fa6Dc149a72b4DFbc17D341E copy

Bitcoin

3ATGMxNzCUFzxpMCHL5sWSt4DVtS8UqXpi copy

Thank you for your support!

Follow Us on Twitter!

:(