
TAM mirage + crabbing market share + nerdy talk is how money is destroyed fastest.
What is unacceptable is that quality VCs still fail to DD investments properly while having zero macro process. They deserve to be sued by LPs.
@sequoia @FTX_Official @SBF_FTX
What is unacceptable is that quality VCs still fail to DD investments properly while having zero macro process. They deserve to be sued by LPs.
@sequoia @FTX_Official @SBF_FTX

Inside job - not sure why that is even a debate.
https://twitter.com/altcoinpsycho/status/1591312517049257984
Marc Cohodes explains a thing or two
https://twitter.com/hedgeye/status/1591240664779743232
Filings showed that Alameda has more than 100,000 creditors.

Optimistic, but John Ray seems to see some „assets“ for now…which of course allows him to pay out his salary
@WifeyAlpha @DrastikThomas @kittysquiddy
@WifeyAlpha @DrastikThomas @kittysquiddy
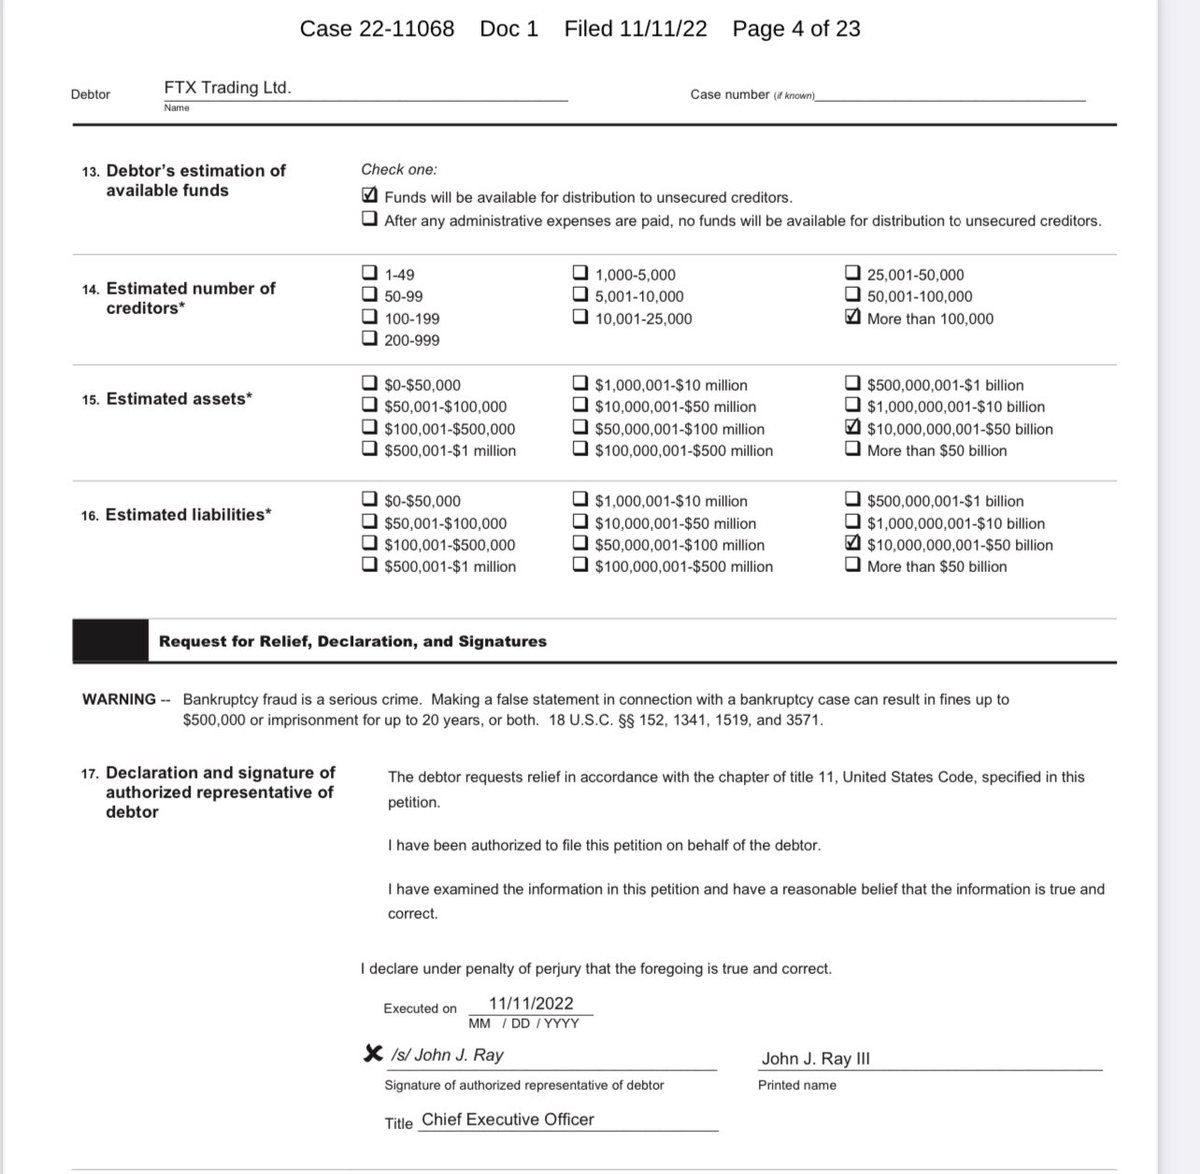
Why? FTX’s biggest asset as of Thursday was $2.2bn worth of a cryptocurrency called Serum. Serum’s total market value was $88m on Sat, acc to CryptoCompare. Personally I doubt 10cent on $ will be returned to creditors in some years.
@DrastikThomas @WifeyAlpha @kittysquiddy
@DrastikThomas @WifeyAlpha @kittysquiddy
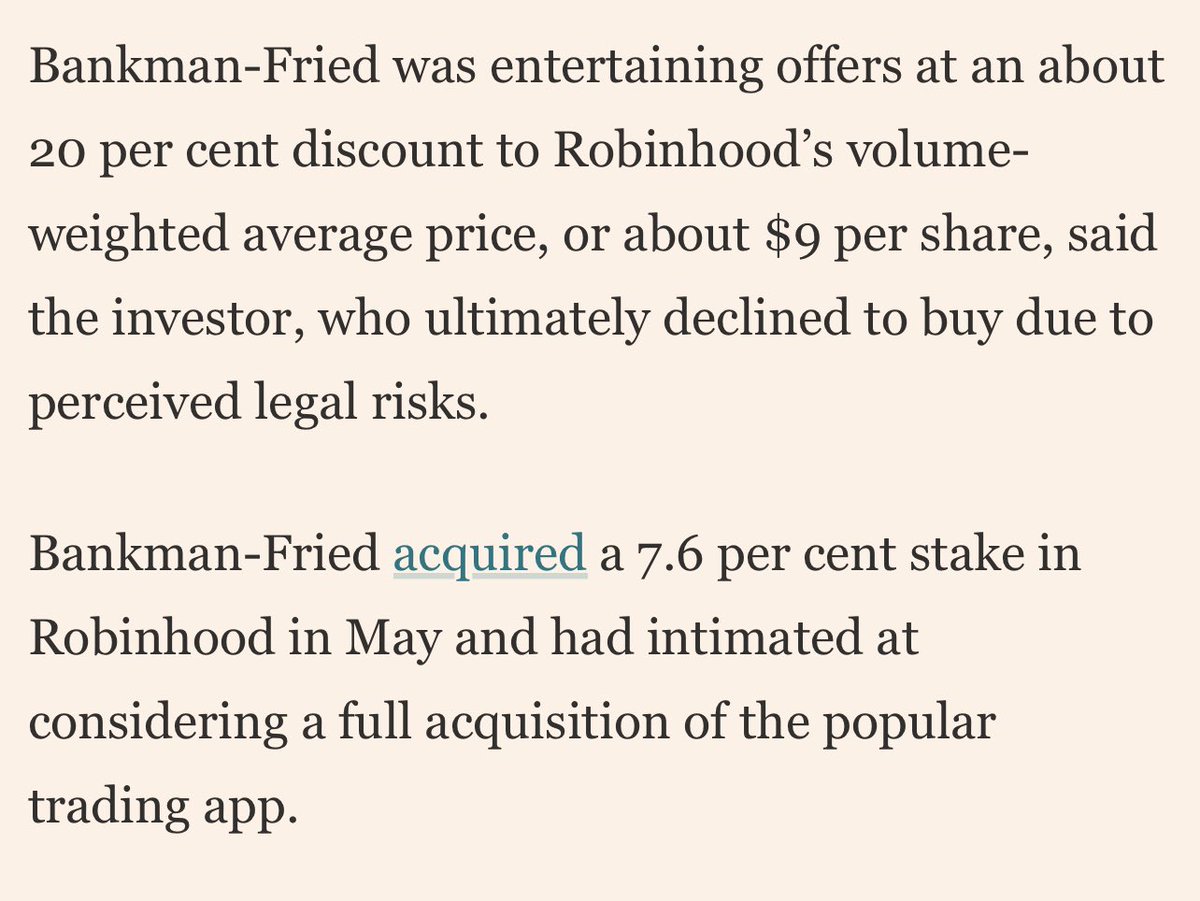
Bankman-Fried personally seems to own shares in Robinhood.
Some value there to be recovered for FTX creditors in a lengthy court process but by now it’s obvious the guy used FTX funds to finance his personal holdings.
@DrastikThomas
Some value there to be recovered for FTX creditors in a lengthy court process but by now it’s obvious the guy used FTX funds to finance his personal holdings.
@DrastikThomas


Given how young this unregulated space is: (a) assume more „FTX issues“ to come to light soon; (b) expect most retailers wanting to liquidate their coins (if they even can) to buy safe $ bills 💵 (oh the irony); which (c) pushes all coins (much) lower in coming weeks.
#Bitcoin
#Bitcoin
Lesson 1:
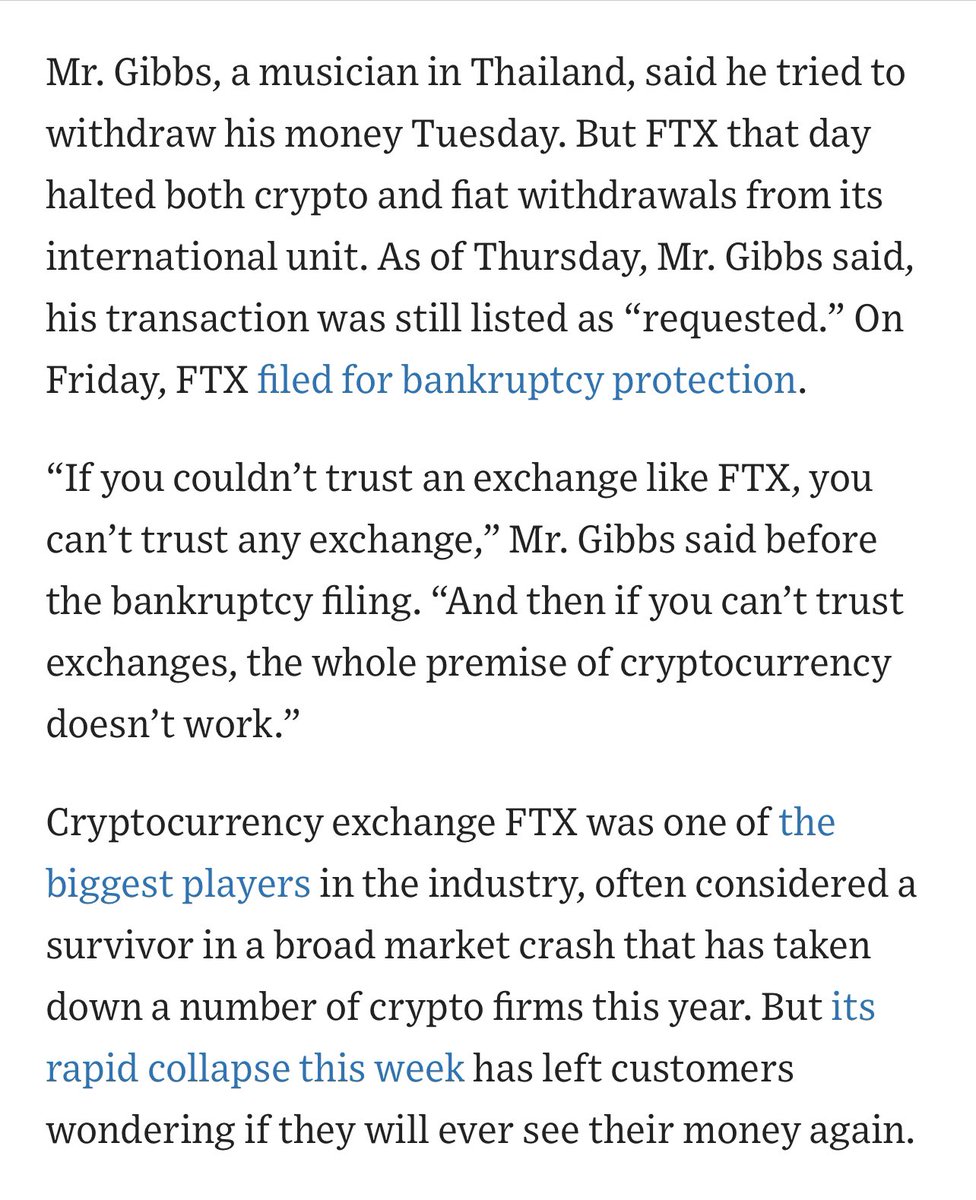
If an exchange goes bust, its users’ „digital assets“ (funny name I know) will go into the bankruptcy estate that lawyers & advisors divvy up: Creditor rankings for payouts means „customers“ come last. Watch & learn with laser eyes…!
wsj.com/articles/a-cry…
If an exchange goes bust, its users’ „digital assets“ (funny name I know) will go into the bankruptcy estate that lawyers & advisors divvy up: Creditor rankings for payouts means „customers“ come last. Watch & learn with laser eyes…!
wsj.com/articles/a-cry…
Lesson 2:
The only thing that matters for any asset when trust vanishes is liquidity. For an exchange however, it always was the only thing that mattered. An exchange going bust & lawyers taking over for years is the mother of “self-feeding” coin value destructions.
#Bitcoin
The only thing that matters for any asset when trust vanishes is liquidity. For an exchange however, it always was the only thing that mattered. An exchange going bust & lawyers taking over for years is the mother of “self-feeding” coin value destructions.
#Bitcoin

Lesson 3:
In a bankruptcy process, the administrator is by definition a destress seller which makes it hard to recover fair value even for the best trophy assets.
Now take a look at the asset & liability table of FTX…
@DrastikThomas
d1e00ek4ebabms.cloudfront.net/production/7ab…
In a bankruptcy process, the administrator is by definition a destress seller which makes it hard to recover fair value even for the best trophy assets.
Now take a look at the asset & liability table of FTX…
@DrastikThomas
d1e00ek4ebabms.cloudfront.net/production/7ab…

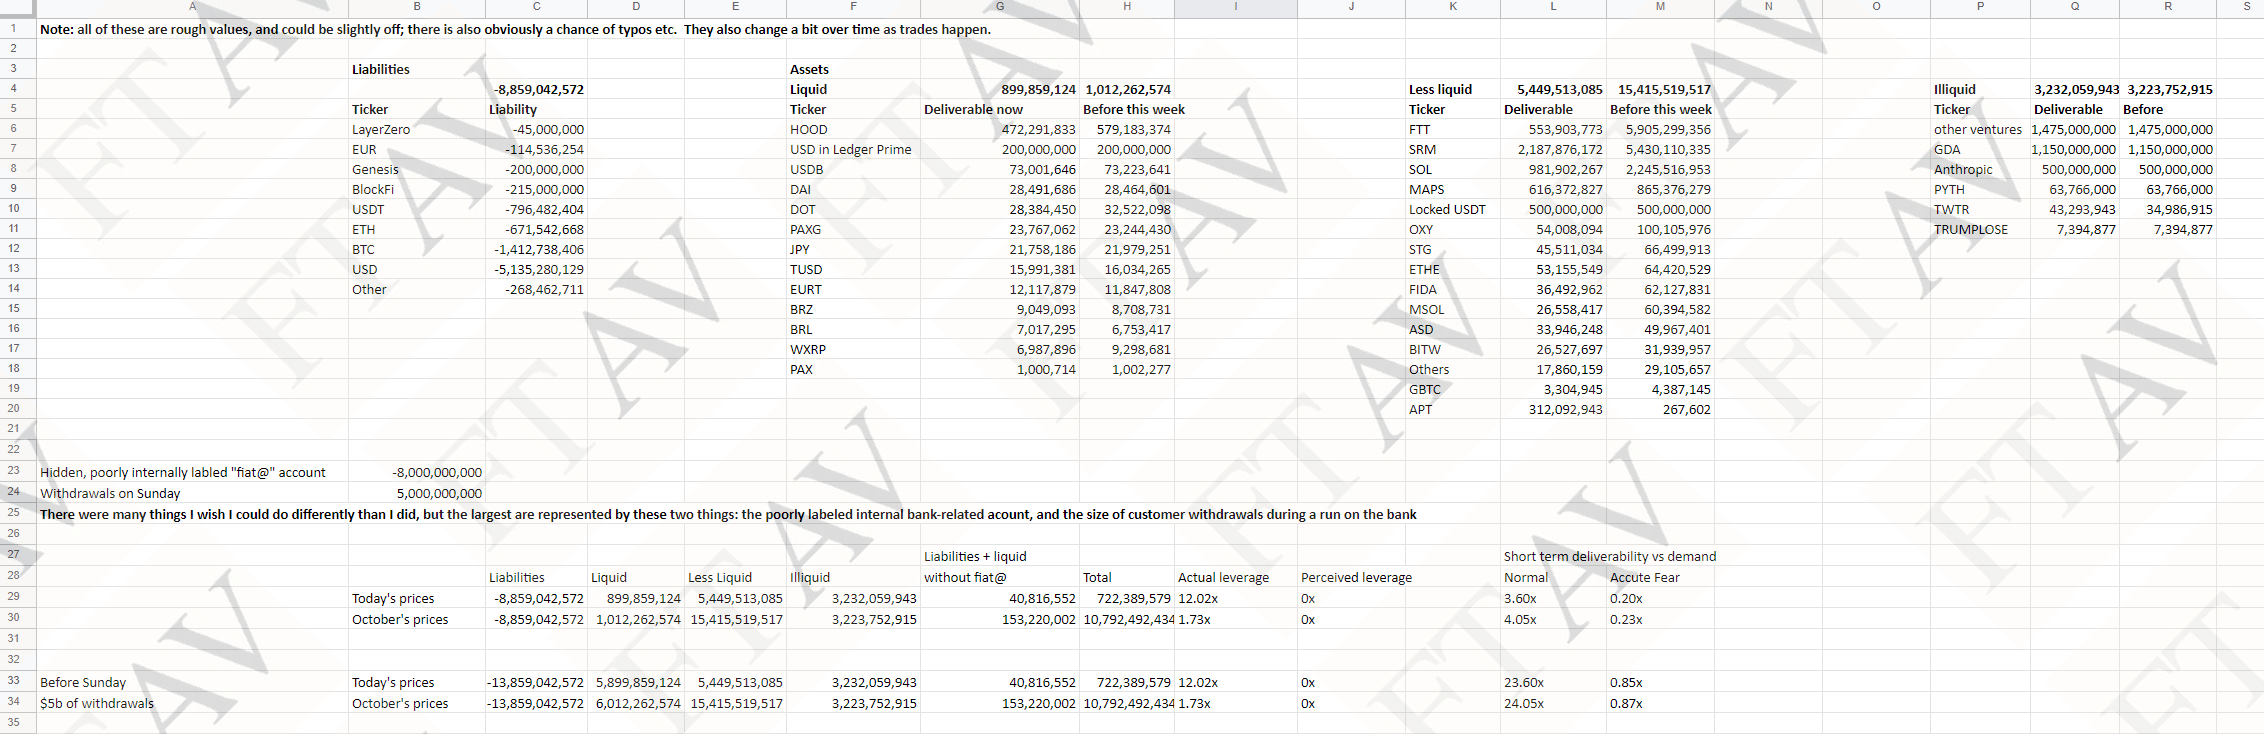
First, imagine being the administrator and receiving an excel scribble like this for an Enron-like size filing!
Let’s look at the liability side first:
USD 5.1bn in debt (likely in form of client deposits or 3rd party lending) is a pretty good starting point.
#FTXbankruptcy
Let’s look at the liability side first:
USD 5.1bn in debt (likely in form of client deposits or 3rd party lending) is a pretty good starting point.
#FTXbankruptcy

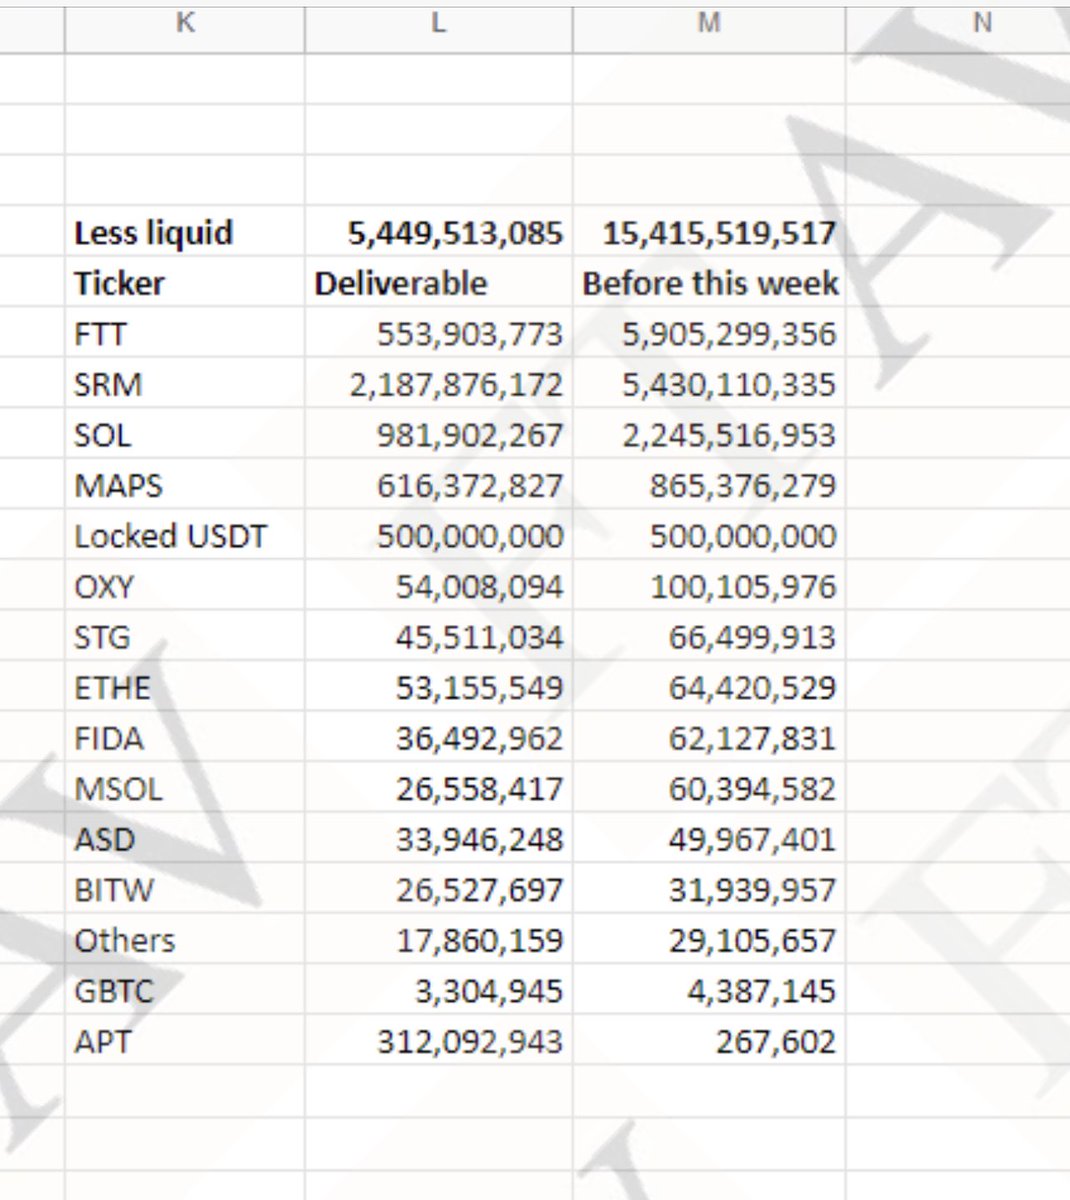
The list divided assets into liquid, less liquid & illiquid.
SRM (Serum) is the largest single asset at $2.2bn valued. We don’t have ownership no but SRM is distressed (-27% as I write this) with a total market cap of $67m for 100% of tokens. Assume nil value!
@DrastikThomas
SRM (Serum) is the largest single asset at $2.2bn valued. We don’t have ownership no but SRM is distressed (-27% as I write this) with a total market cap of $67m for 100% of tokens. Assume nil value!
@DrastikThomas


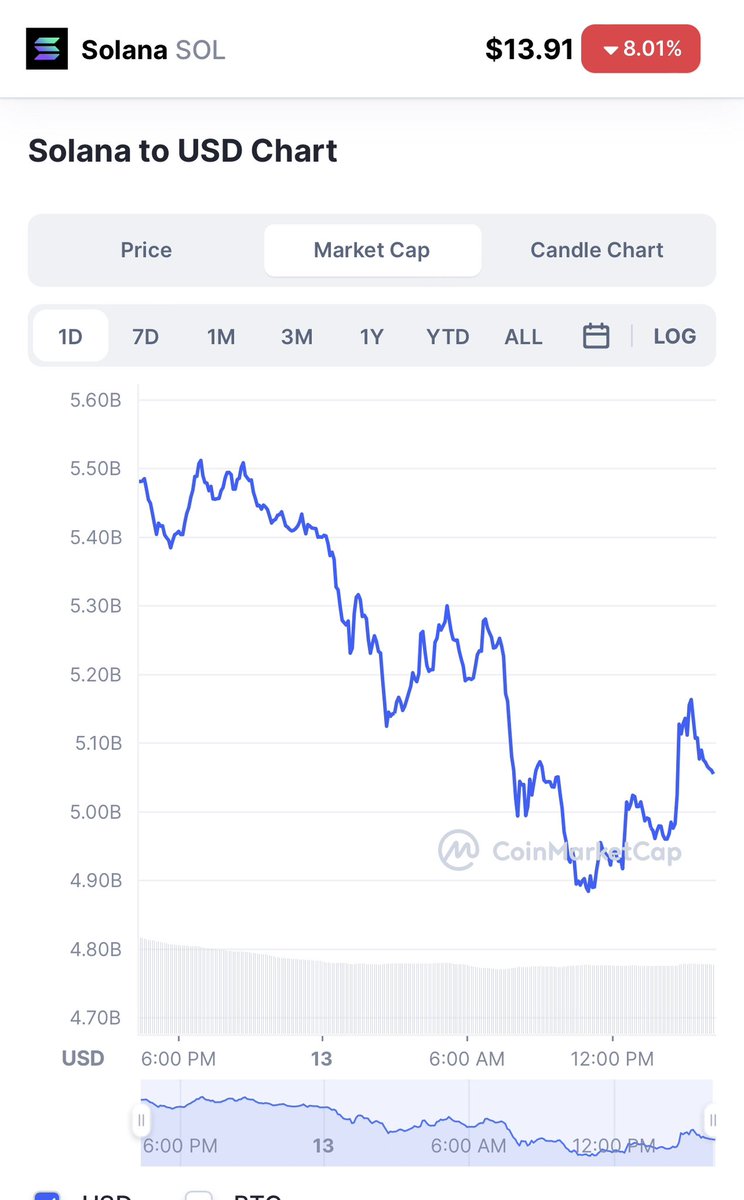
Next: Solana (SOL).
Again, we don’t know how many Alameda owned but at least there seems a $5bn market cap left, although that is falling quickly…I suspect some value is recoverable here but never the quoted $900m. Perhaps $50-100m ?
Again, we don’t know how many Alameda owned but at least there seems a $5bn market cap left, although that is falling quickly…I suspect some value is recoverable here but never the quoted $900m. Perhaps $50-100m ?

Next: FTT was FTX/Alameda’s own token: a zero buy definition - not $550m - although the market hasn’t fully priced that yet (market cap still $230m for 100% tokens).
@DrastikThomas
@DrastikThomas

And MAPS, quoted at $616m value? Well, the whole token cap is $3m while the coin is -28% as we write this.
Prima vista #FTX is a likely write off for 100,000 depositors (creditors) after studying the 4 largest positions as stated by mgmt.
@DrastikThomas @BobgonzaleBob
Prima vista #FTX is a likely write off for 100,000 depositors (creditors) after studying the 4 largest positions as stated by mgmt.
@DrastikThomas @BobgonzaleBob

• • •
Missing some Tweet in this thread? You can try to
force a refresh


