Charles Edwards Profile picture
Dec 6 16 tweets 6 min read
Bitcoin Bottom Signal Series.

A thread of on-chain signals which suggest the Bitcoin bottom is in, or very close. In my opinion, these are the most important on-chain metrics today. Based on Bitcoin's 13 year history, they are telling me this is an extraordinary opportunity.
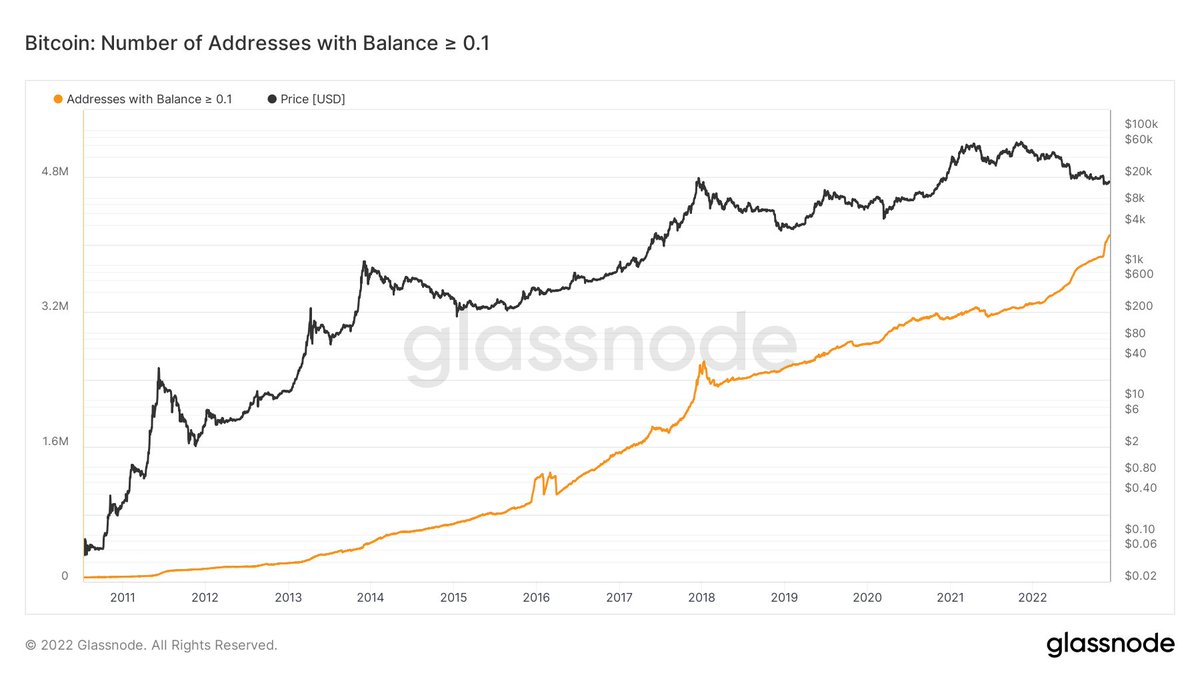
Adoption all-time-high. Despite a $10B fraud by FTX, Bitcoin adoption is screaming higher. We are witnessing one of the highest growth rates in addresses with >0.1 Bitcoin in history, seconded only by 2017. More and more people are locking away 1000s of dollars of Bitcoin.
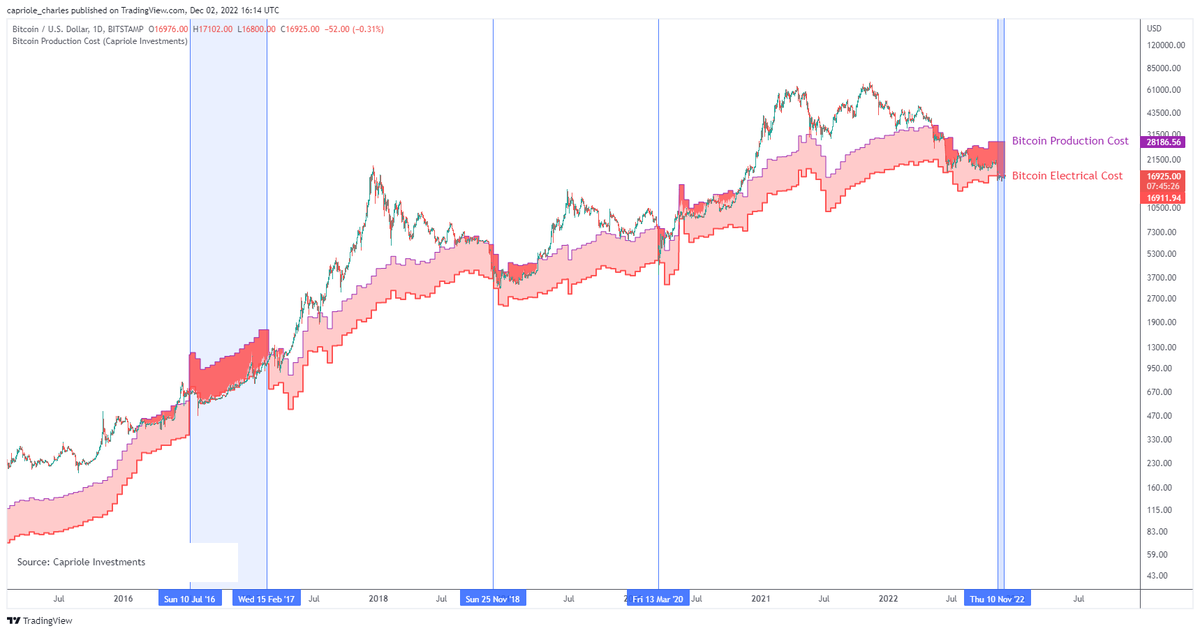
There have been only 4 periods ever of price below global Bitcoin Electrical Cost. A price point which has been a historical floor for Bitcoin. All looked like incredible buys in hindsight. You wanted to buy below electrical cost? We had a month there and now it's gone.
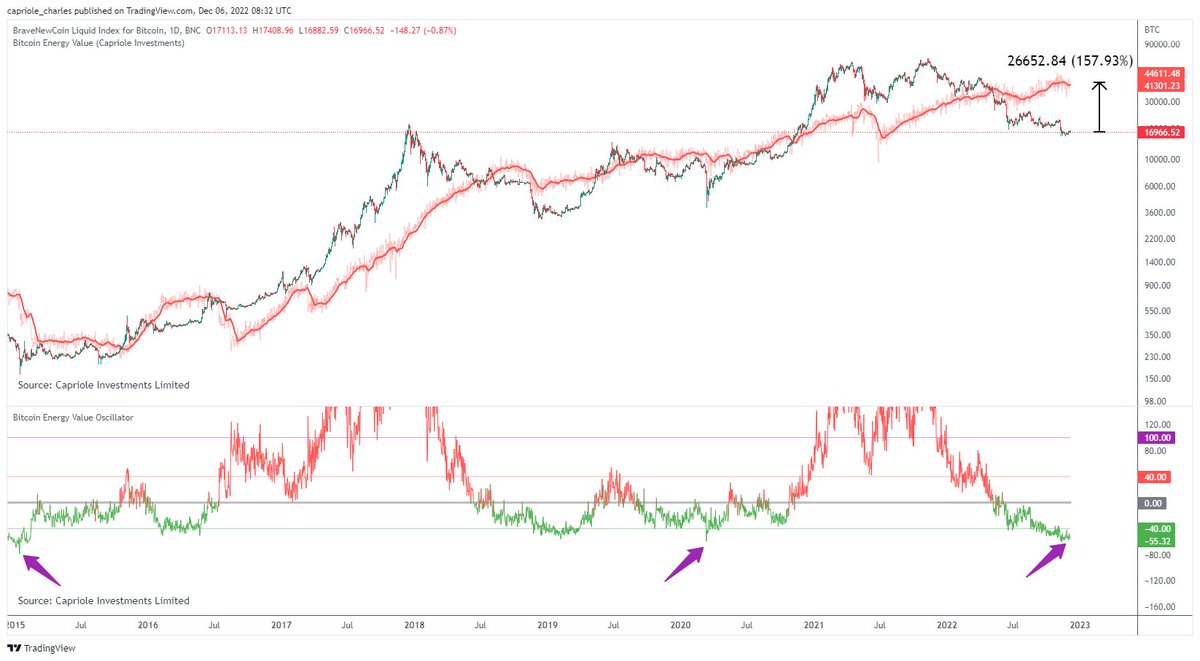
Price is trading at a 55% discount to Bitcoin Energy Value, Bitcoin's fair value priced using pure watts of energy in the network. That's the biggest discount since price hit $4K on 13 March 2020 and $160 on 14 January 2015. Bitcoin was 100X smaller then. Fair value today: $41K.
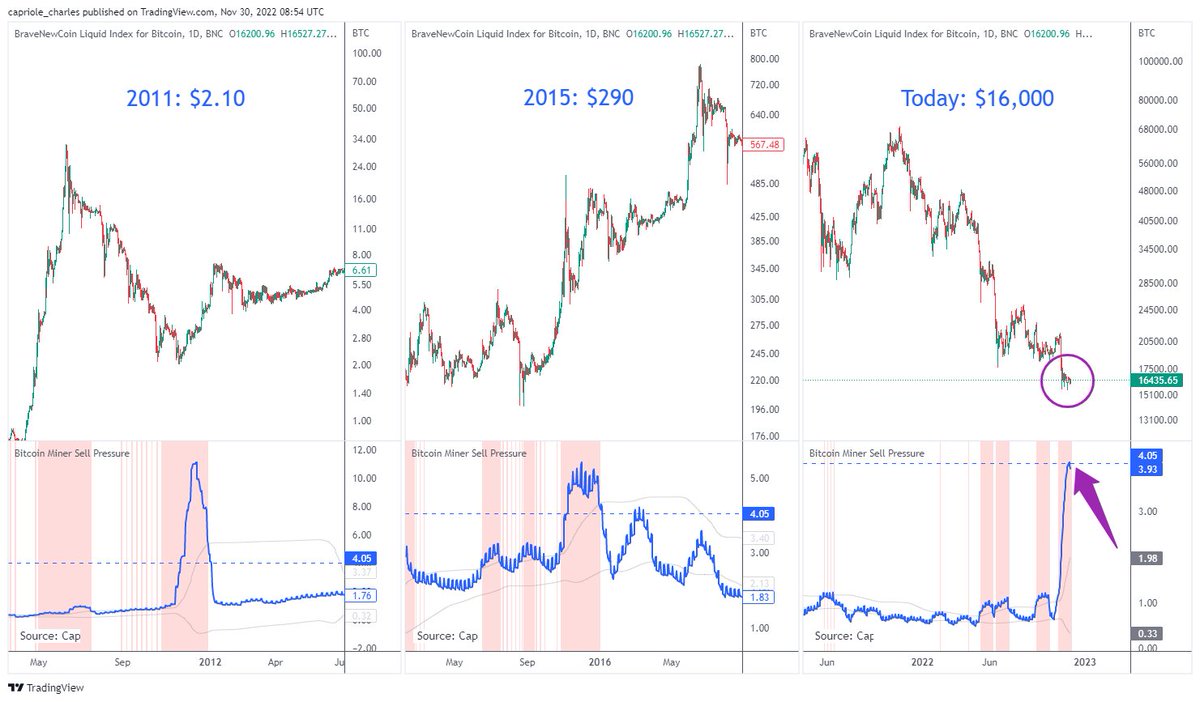
Bitcoin miner selling stress is at the 3rd highest of all time. The other times this occurred, price was at $290 and $2. I would love to have bought Bitcoin then.
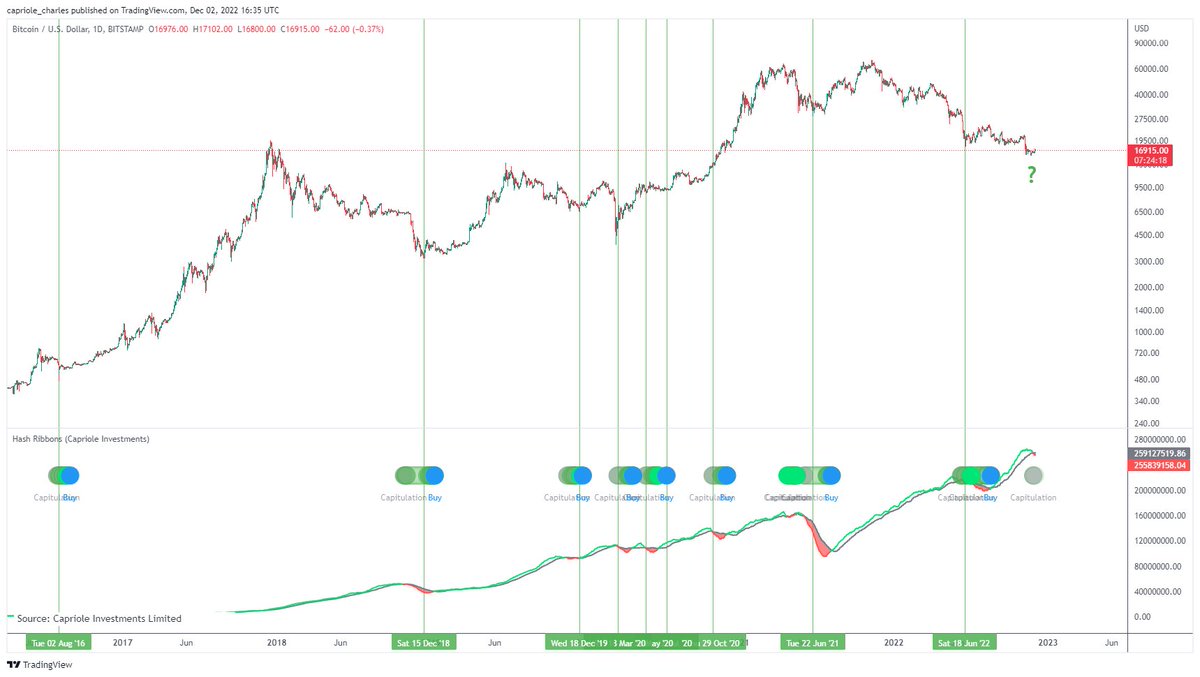
Deep value. Hash Ribbons has confirmed a miner capitulation. This is perhaps the best performing long-term buy signal for Bitcoin. A price low typically forms during the capitulation. Sometimes the first candle of the miner capitulation is the low.
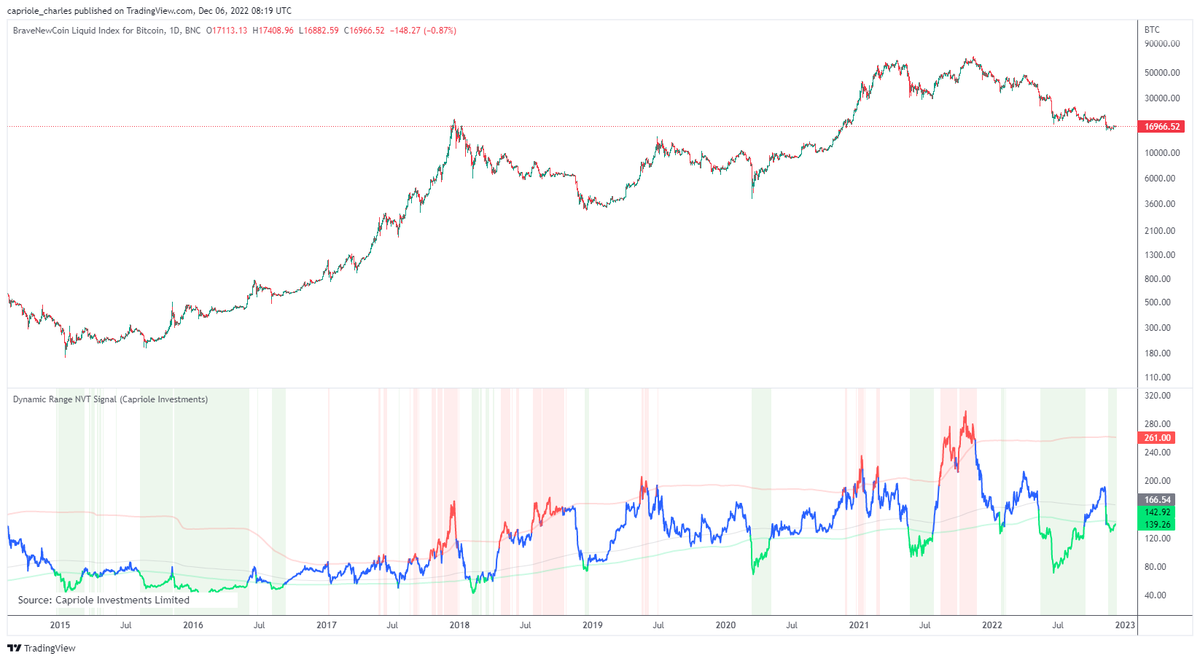
Dynamic Range NVT, the Bitcoin "PE Ratio", is once again in the green zone. This tells us the network is priced cheap versus the transaction value flowing through on-chain. My guess is we probably wouldn't be here if it wasn't for the FTX fraud, but somewhere in the mid-$20s.
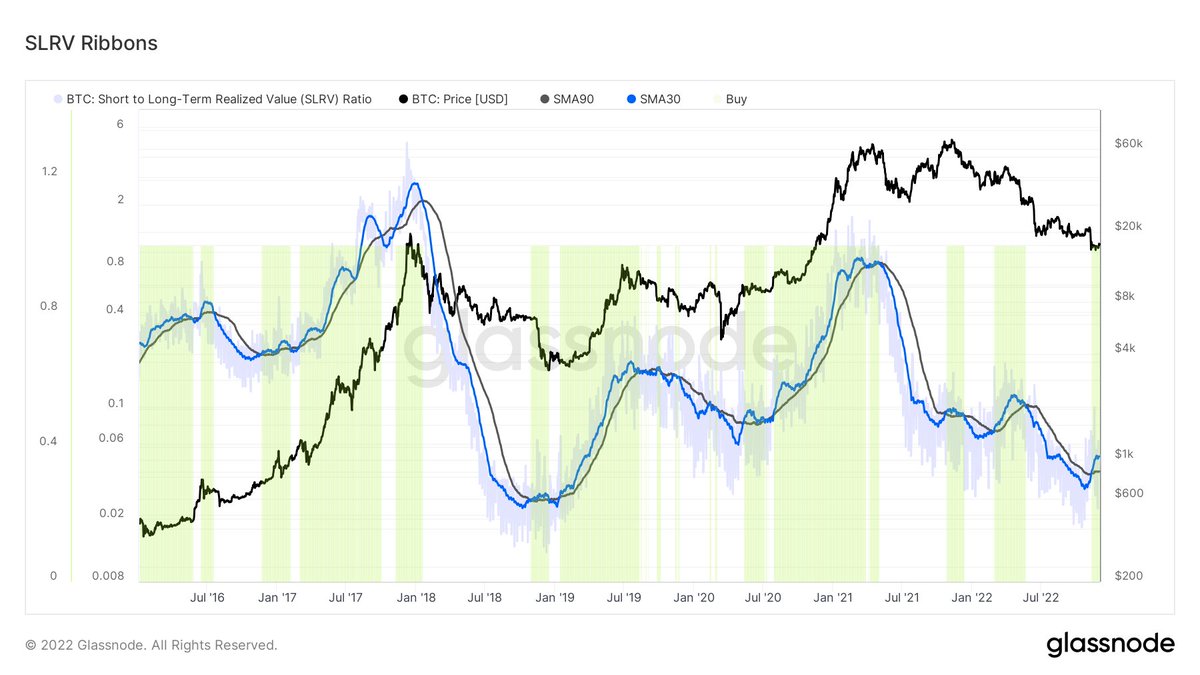
The SLRV Ribbons finally crossed bullish at $16.6K. This was one of the last major on-chain metric to flip bullish at the lows. You can read more about this strategy and how it beats buy-and-hold here:
medium.com/capriole/slrv-…
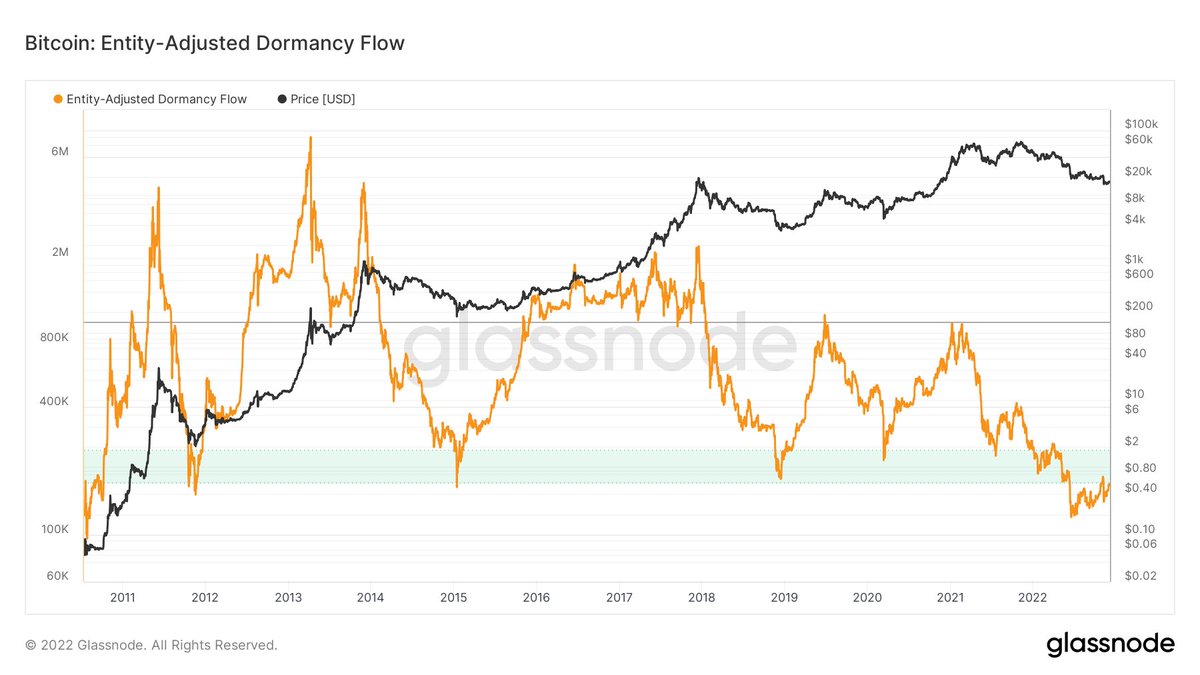
Dormancy Flow has spent much of the last months at all-time-lows. Per creator @dpuellARK:

"whenever dormancy value overtakes market capitalization at lowest longitudinal levels, the market can be considered in full capitulation — a good historical buy zone."

More deep value.
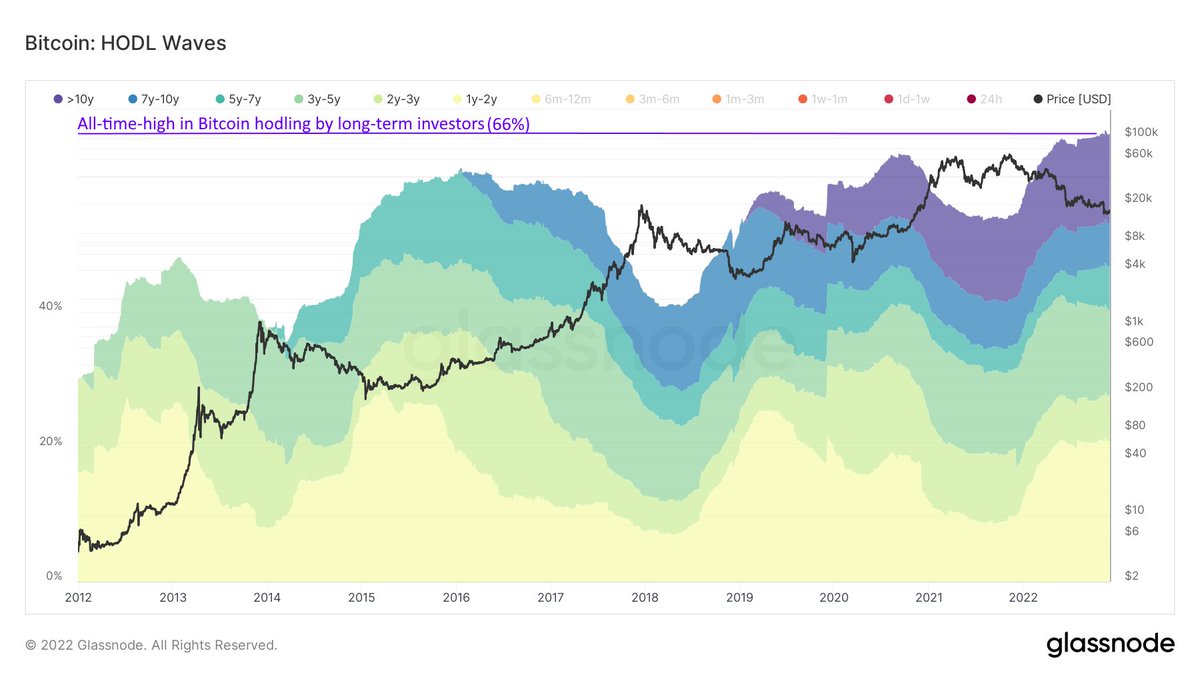
We have an all-time-high in long-term hodling. Those keeping Bitcoin at least 1 year now represent more of the network than ever before, 66%. Prior peaks of long-term holding all aligned with bear market toughs.
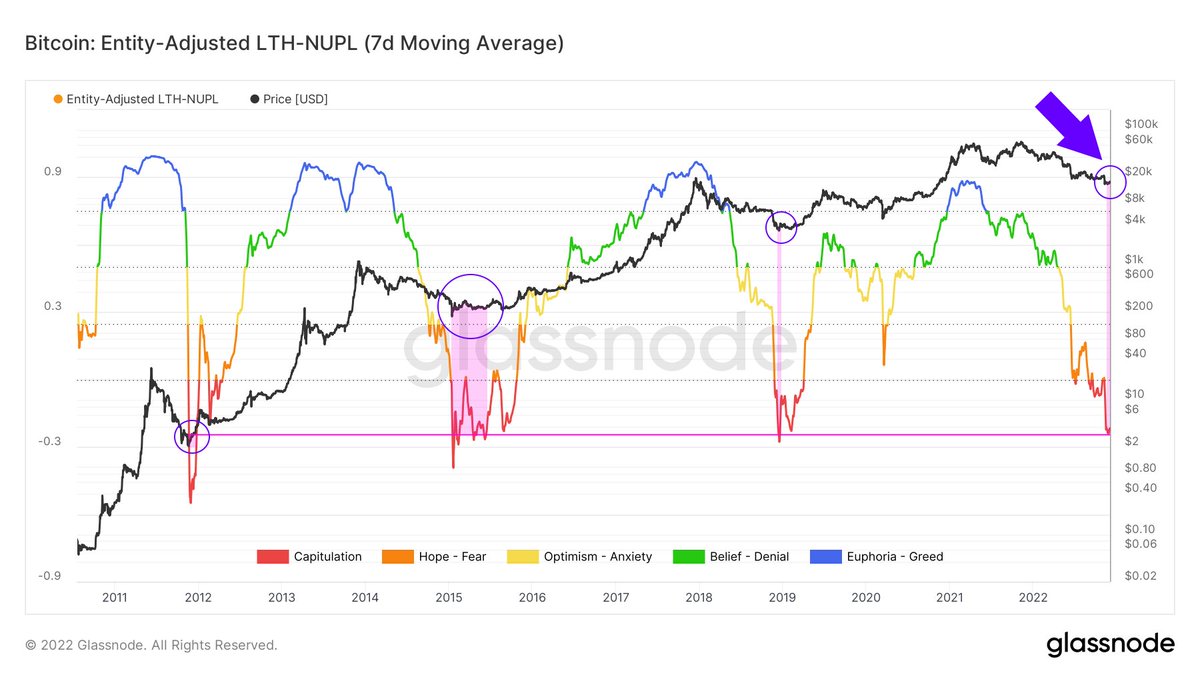
Many of these same long-term holders are in a deep downdraw. Downdraws have hit prior halving cycle lows in the -80% region. Sure it can always go a bit lower, but to me it's clear where the risk-reward is skewed on long-term holder NUPL.
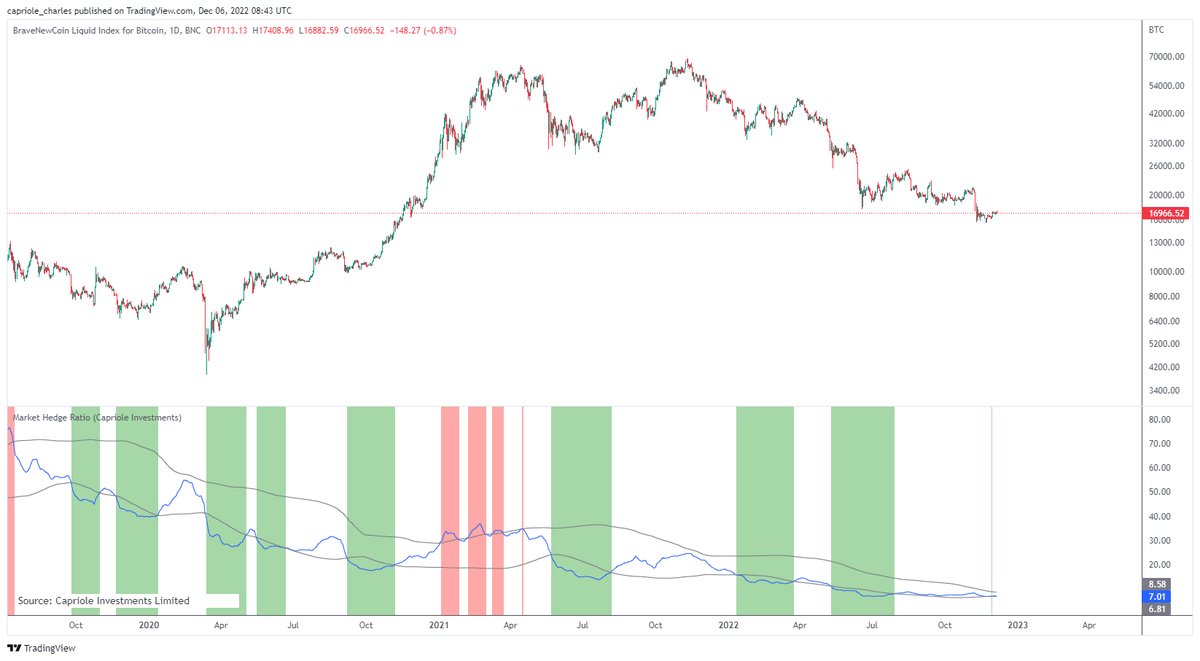
Looking at the main stablecoins USDC and USDT, the market is more hedged than ever before. People are not parking their savings in stablecoins if they are leaving this industry, this is dry powder waiting to be deployed. More than likely it will fomo into the next major rally.
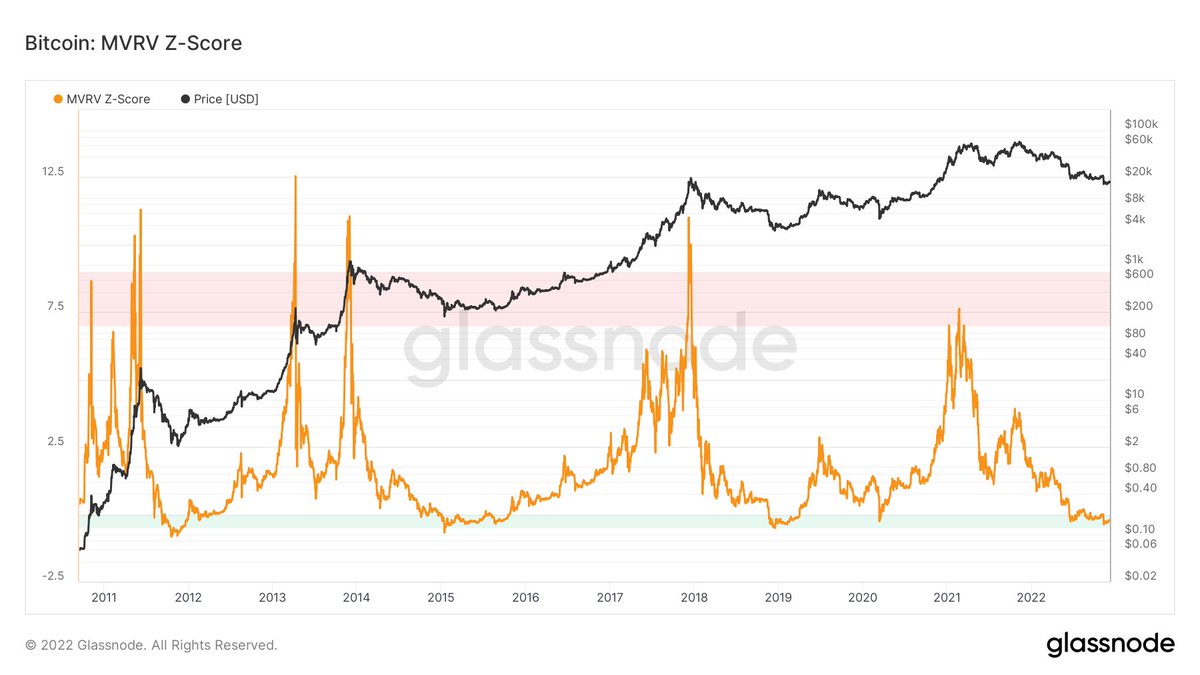
MVRV Z-score, today's market is priced incredibly cheap based on Realized Value. Depth and duration look uncannily similar to the prior cycle bottoms too.
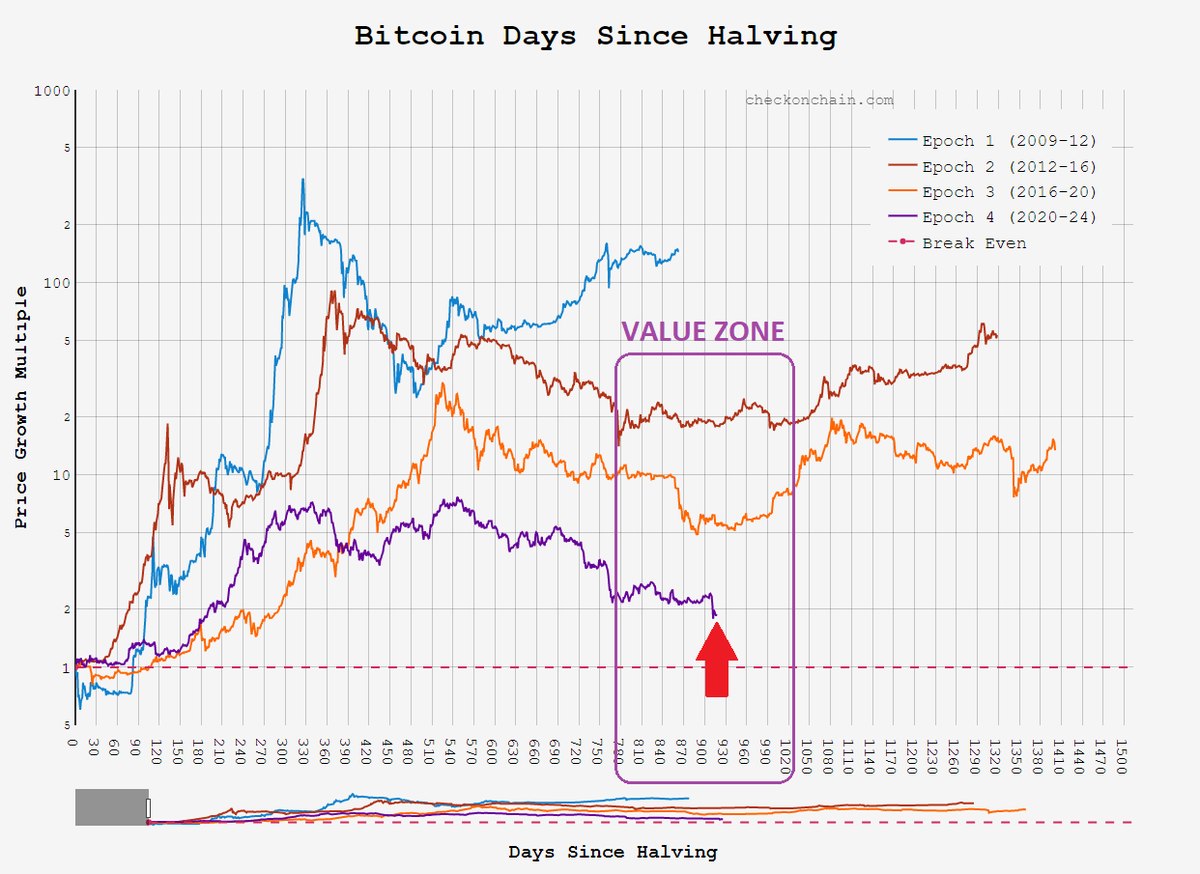
Finally, it's not just the data that is screaming "Bitcoin is cheap", but we are also situated smack-bang in the bottom zone for every prior Bitcoin halving cycle. This is where sentiment has always bottomed and the best long-term investments were made.
Summary:

✅Incredible miner stress and capitulation
✅Long-term holder capitulation
✅All-time-high adoption
✅All-time-high hodling
✅Largest ever store of stablecoin dry powder
✅Massive discounts on NVT, MVRV, Dormancy, +
✅Optimal cycle timing for a bottom
For me, these are the most important Bitcoin investment metrics. But please do your own research, this is not investment advice. This thread focused only on on-chain data. I personally primarily invest using autonomous trading algorithms that manage my risk with @capriole_fund.

• • •

Missing some Tweet in this thread? You can try to force a refresh
 

Keep Current with Charles Edwards

Charles Edwards Profile picture

Stay in touch and get notified when new unrolls are available from this author!

Read all threads

This Thread may be Removed Anytime!

PDF

Twitter may remove this content at anytime! Save it as PDF for later use!

Try unrolling a thread yourself!

how to unroll video
  1. Follow @ThreadReaderApp to mention us!

  2. From a Twitter thread mention us with a keyword "unroll"
@threadreaderapp unroll

Practice here first or read more on our help page!

More from @caprioleio

Nov 11
Bitcoin miners are in pain and selling more than they have in almost 5 years!

Introducing: Bitcoin Miner Sell Pressure.

A free, open-source indicator which tracks on-chain data to highlight when Bitcoin miners are selling more of their reserves than usual.
The indicator tracks the ratio of on-chain miner Bitcoin outflows to miner Bitcoin reserves.

- Higher = more selling than usual
- Lower = less selling than usual
- Red = extraordinary sell pressure

Today, it's red.
What can we see now?

Miners are not great at treasury management.

They tend to sell most when they are losing money (like today). But there have been times when they sold well into high profit, such as into the 2017 $20K top and in early 2021 when Bitcoin breached $40K.
Read 5 tweets
Nov 2
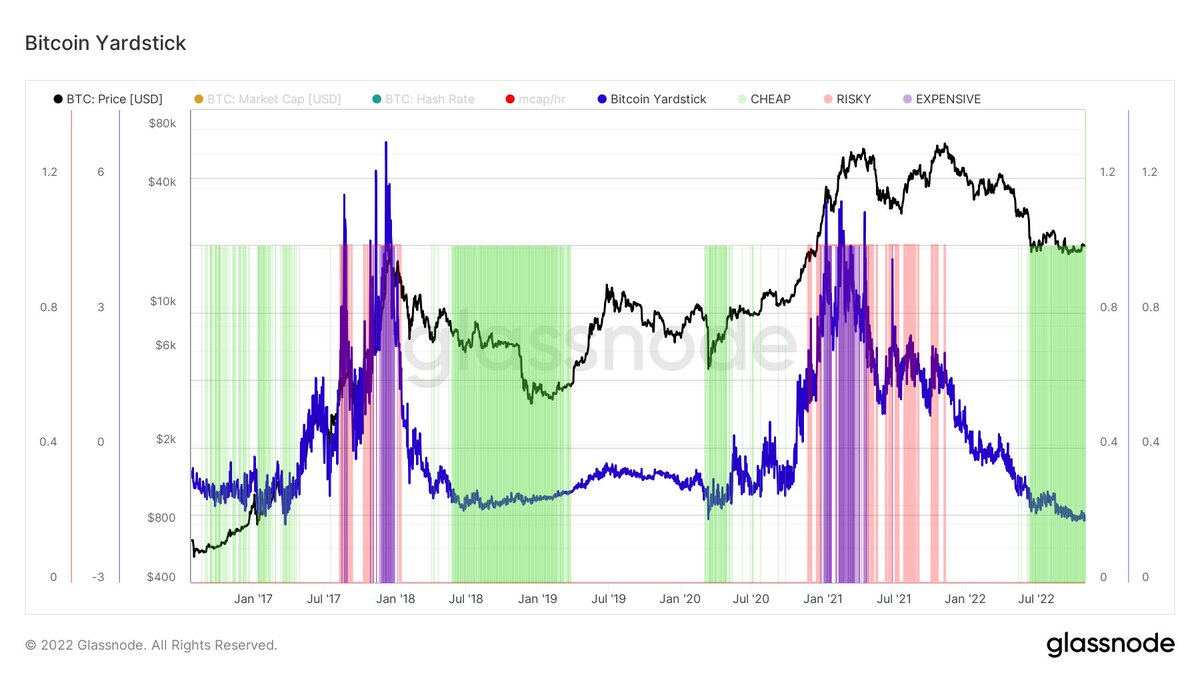
Introducing: The Bitcoin Yardstick

Today we are seeing valuations unheard of since Bitcoin was $4K.

A very simple, rule-of-thumb Bitcoin valuation tool.

Bitcoin Yardstick = market-cap / hash-rate, normalized over 2 years of data.

As always: not investment advice.

A short🧵
Similar in concept to a PE Ratio, except instead of stock earnings, the Bitcoin Yardstick is taking the ratio of energy work done to secure the Bitcoin network in relation to price.

Lower readings = cheaper Bitcoin = better value.

2/6
Here's an application of the Bitcoin Yardstick which identifies when Bitcoin is:

- Cheap: Yardstick > 1 deviation under the mean
- Risky: Yardstick > 2 deviations above the mean
- Expensive: Yardstick > 3 deviations above the mean

3/6
Read 6 tweets
Aug 3
The 12 Bitcoin Capitulations.

The raw count of evidence for major Bitcoin capitulation today is insane.

Each occurrence alone is a rare event and adds to the probability that forward risk-returns are skewed positively.

Let’s take a look at the 12 signs #Bitcoin capitulation:
(1) Supply transferred at a Loss (NEW METRIC).

The percentage of total supply transferred at a loss hit 1.9% last month. Historically, when this metric breaches 1.5% it demonstrates that a large portion of the market is in pain. Most were also great accumulation zones.
(2) BitFinex Whales are Dead.

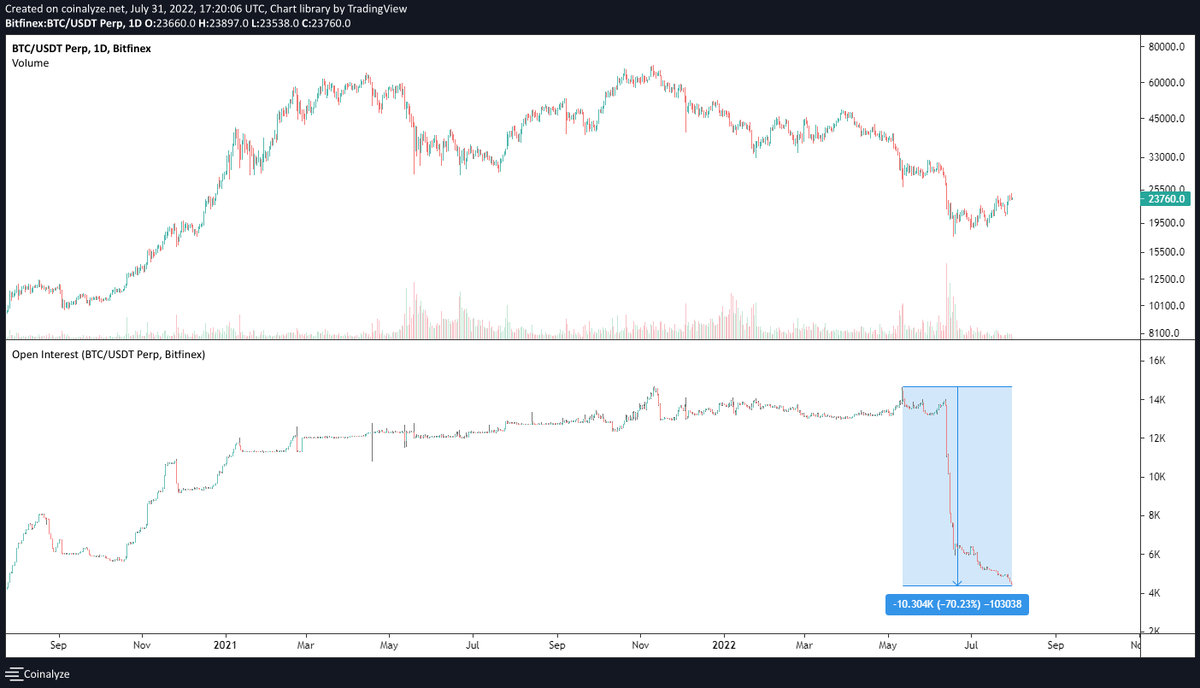
BitFinex is known as the "home of whale traders", it has seen its Bitcoin perp Open Interest drop over 70% in the last 2 months.

BitFinex whales have been clinically wiped out.
Read 15 tweets
Jul 31
𝗦𝘂𝗿𝘃𝗶𝘃𝗶𝗻𝗴 𝘁𝗵𝗲 𝗯𝗲𝗮𝗿

There are only 2 ways to survive a crypto bear market:

(1) Unleveraged hodling for dear life
(2) Trading (in attempt to “buy low and sell high”)

🧵 Image
None of this thread is investment advice. There are always outliers to the norm. Do your own research and make an informed decision!

These are just some of my personal insights from weathering this highly volatile market the last 5 years.
The Popular “Third Option”

Many entities got greedy in 2021 and tried a third option: “Hodl with leverage” in an attempt to get superior positive returns.

As we have seen in the last months, this approach fails in crypto, with catastrophic losses bringing down many businesses.
Read 13 tweets
May 11
My bear market dream is buying at the Bitcoin Electrical value price. So currently around $23K.

But during Bitcoin's life, we have never had a proper, lasting tradfi bear market.

The S&P is only down -18% (nothing) so far.

This changes everything...

1/n
2/

While a lot of metric are oversold, suggesting we are due for a short-term bounce, a lot of tradfi charts are turning really sour.

Equally weighted S&P500.

Can a topping formation get much uglier than this?
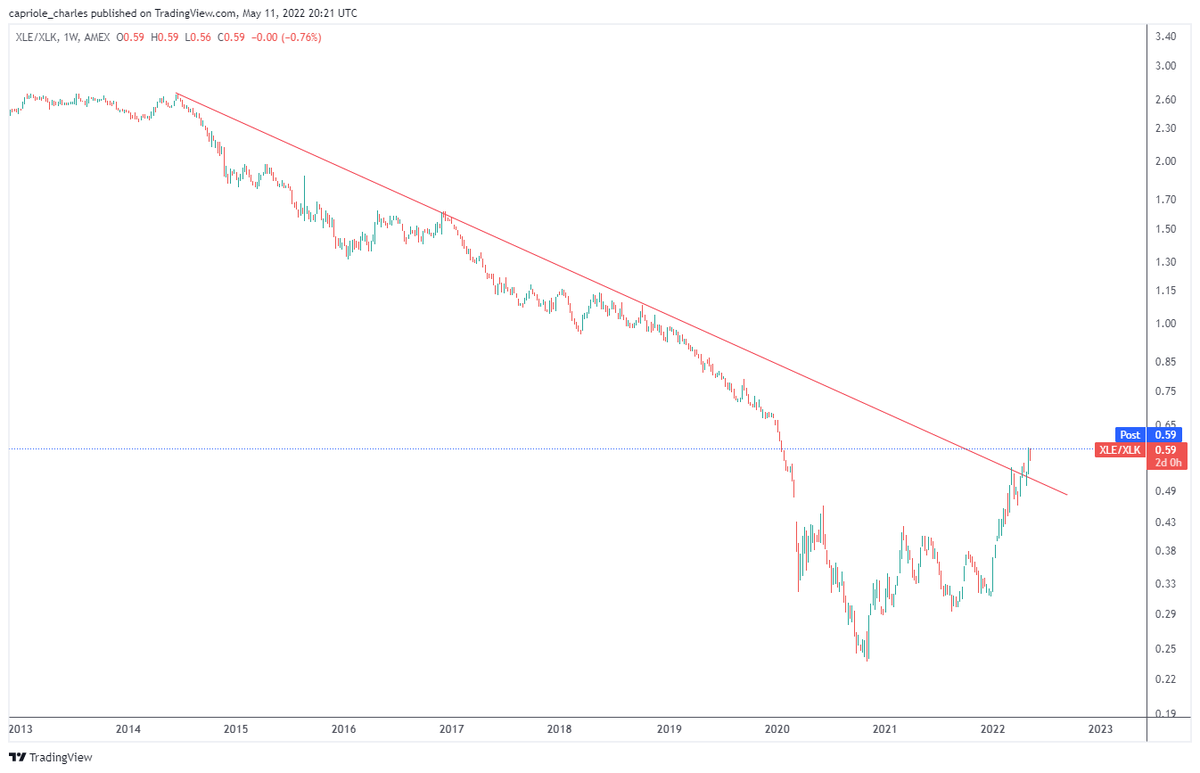
3/ Energy vs Tech.

Decadal breakout happening right now.
Read 15 tweets
Feb 24
Impact of war on markets.

Generally speaking, invasions mark bottoms.

However, the most recent wars on record were relatively small and did not involve a significant risk of potential escalation to a direct conflict between multiple major powers.

The Ukraine war could. Image
Perhaps a better comparison to today's Ukraine war is the pre-information age conflicts, such as Korea and WW2.

From onset, these had an average draw down of -16%, bottoming within 1-5 months.

Assumes Russia is seeking an empire building campaign, potentially with others. Image
I believe there has been a lot more pricing in today though, given the depth and speed of communications in 2022 and broader market efficiencies vs 70+ years ago.

The S&P hasn't gone down more than 2.5% in a single day this week, more than 35% less than these prior two events.
Read 8 tweets

Did Thread Reader help you today?

Support us! We are indie developers!


This site is made by just two indie developers on a laptop doing marketing, support and development! Read more about the story.

Become a Premium Member ($3/month or $30/year) and get exclusive features!

Become Premium

Don't want to be a Premium member but still want to support us?

Make a small donation by buying us coffee ($5) or help with server cost ($10)

Donate via Paypal

Or Donate anonymously using crypto!

Ethereum

0xfe58350B80634f60Fa6Dc149a72b4DFbc17D341E copy

Bitcoin

3ATGMxNzCUFzxpMCHL5sWSt4DVtS8UqXpi copy

Thank you for your support!

Follow Us on Twitter!

:(