Kevin Fatkin Profile picture
Dec 8, 2022 8 tweets 5 min read Read on X
Today I want to do a run down of the current market outlook using Dark Pools, Dealer Positioning and market wide Options Flow to inform our #optionstrading and #futurestrading today. Data can change but it will help formulate a plan.
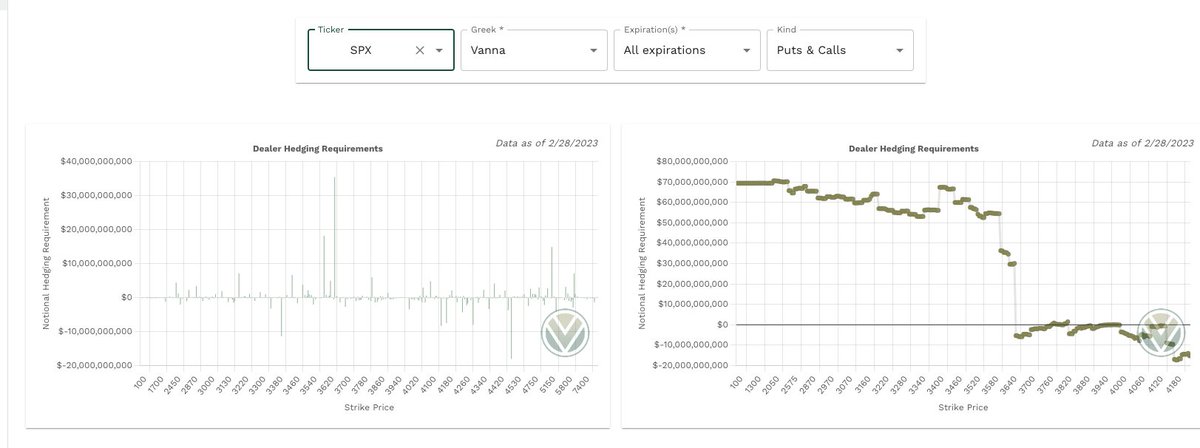
Lets start with $SPX Gamma and Vanna courtesy of @WizOfOps #volland. We see a small, diminishing magnet at 4000. Accellerants to the downside if broken, but will initially be supportive (see attached). ImageImage
Now lets do the same for $SPY but add in some additional data points from @Tradytics data driven insights. Structure indicates pinning, however if we break below 392, accelerants could be significant. ImageImageImage
$SPY Dark Pools help paint the the picture further. Lots of resistance above, with some less intense support below. ImageImage
Now, let's take a look at market net flow and delta positioning across the market. Puts continue to accumulate, most likely for downside protection in preparation for big events. ImageImage
Lastly, we need to make sure we keep all the upcoming macro number releases in mind as they are the big fundamental drivers of the market. We had jobless claims this morning, with PMI tomorrow. Image
The big ones are Monday and Tuesday so I wouldn't be surprised to see us in consolidation until Tuesday, at which point the data will trigger a massive move (consider straddles for that!) Image
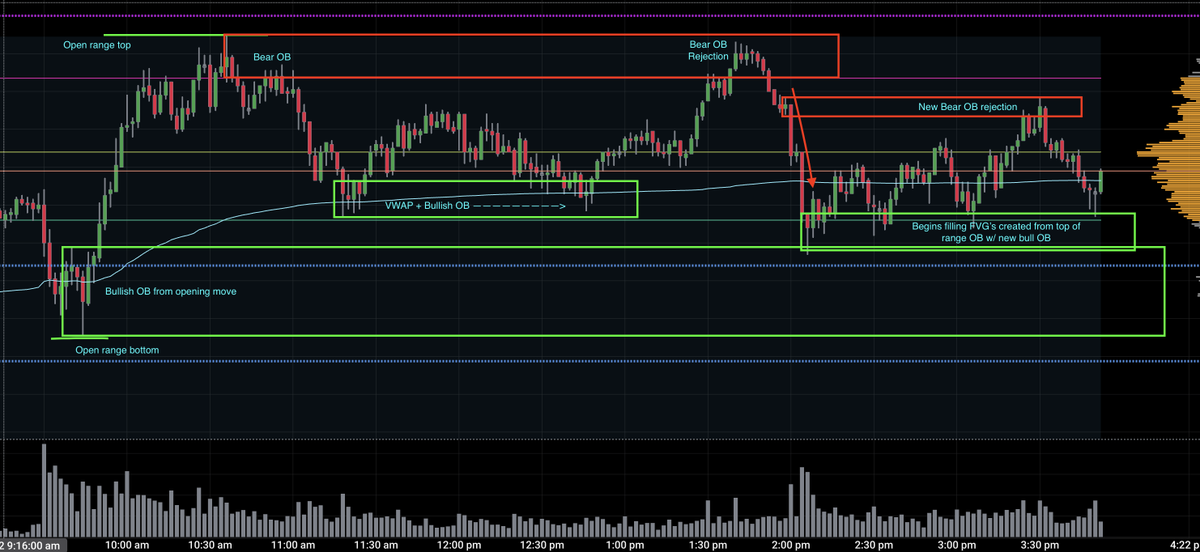
The data showed we'd be in consolidation today in a tight range. Once opening move completed, here's how it played out. Despite the tight range presenting itself, The top bearish OB and bottom bullish OB were hit once each. VWAP also played a part twice. Image

• • •

Missing some Tweet in this thread? You can try to force a refresh
 

Keep Current with Kevin Fatkin

Kevin Fatkin Profile picture

Stay in touch and get notified when new unrolls are available from this author!

Read all threads

This Thread may be Removed Anytime!

PDF

Twitter may remove this content at anytime! Save it as PDF for later use!

Try unrolling a thread yourself!

how to unroll video
  1. Follow @ThreadReaderApp to mention us!

  2. From a Twitter thread mention us with a keyword "unroll"
@threadreaderapp unroll

Practice here first or read more on our help page!

More from @Fatty_Trades

Mar 1, 2023
Here is my evening rundown of $SPX and $SPY Dealer and Dark Pool data to prepare us for #optionstrading & #futurestrading tomorrow using data from @WizOfOps Vol.land and @Tradytics. Show thread to see it all! 🧵👇
Lets start with #Vanna on $SPX & $SPY. $SPX cumulative Vanna picture still neutral in this range with positive vanna favoring downside and negative vanna hurting moves higher. $SPY is similar but with more positive vanna favoring downside should $VIX/IV continue to rise.
Aggregate #Charm up next on $SPX & $SPY. $SPX is now much more inline with $SPY with positive charm exceeding negative charm. This means dealer selling will take place as time passes on these contracts.
Read 11 tweets
Feb 28, 2023
Another condensed post tonight combining what I believe to be the most useful market data to help prepare for tomorrow. Show thread to see it all! 🧵👇
Lets start with #Vanna on $SPX & $SPY. $SPX cumulative Vanna picture still neutral in this range with positive vanna favoring downside and negative vanna hindering moves higher. $SPY is similar but with more positive vanna favoring downside should $VIX/IV rise.
Aggregate #Charm up next on $SPX & $SPY. $SPX charm is neutral as well, but slightly more negative which is slightly bullish. However, $SPY is still positive which favors downside. Combining the two has dealers doing slightly more selling as time decays.
Read 13 tweets
Feb 27, 2023
Someone asked on YouTube if I could review $TSLA data going into the week, so here it goes. Hope others who trade it regularly find it helpful.
$TSLA #Vanna data shows cumulative Vanna positive until 185, at which point it goes negative and would repel moves lower as IV rises with price dropping (within the vanna curve). Positive Vanna around price and above will increase volatility until that point. Image
Looking at $TSLA Gamma we see dealers assisting moves through 195 and 197.50 due to negative gamma with 200 being a positive gamma which will act as resistance (support if broken). #Charm is slightly more negative which is slightly more bullish. ImageImage
Read 8 tweets
Feb 27, 2023
Here is my evening rundown of $SPY & the overall market using data driven insights by @Tradytics. The data provided will help us formulate a plan for tomorrow to inform our #optionstrading and #futurestrading. Show thread to see it all! 👇
We see Algoflow divergences below. These are assets where net flow is diverging from price. Finance sector and related names stand out as bearish. The bullish names like $U, $GE, $NFLX, $BA & $ENPH warrant a closer look for details. Image
The $SPY 3-day delta/price correlations show a 30% total chance of moving up to 2.7% higher and a 50% total chance of moving down as much as -3.7% over the next 3 days. Dealers are still long. Expected volatility has dropped slightly. ImageImageImage
Read 8 tweets
Feb 27, 2023
Here is my evening summary of dealer positioning $SPX, $SPY & $QQQ. The data is provided by Vol.land, created by @WizOfOps, and will help us identify key areas tomorrow to inform our #optionstrading and #futurestrading. Show thread to see it all! 🧵👇
Lets start with #Vanna on $SPX & $SPY. $SPX cumulative Vanna picture is neutral in this range with positive vanna favoring downside and negative vanna hurting moves higher. $SPY is similar but with much more positive vanna favoring downside should $VIX/IV continue to rise. ImageImage
Aggregate #Charm up next on $SPX & $SPY. $SPX charm is pretty neutral as well, but slightly more negative which is slightly bullish. However, $SPY is very positive which favors downside. ImageImage
Read 8 tweets
Jan 18, 2023
Here is my morning summary of $SPY using data driven insights @Tradytics. The data provided will help us formulate a plan for the day to inform our #optionstrading and #futurestrading. Show thread to see it all! 👇
The $SPY #Gamma based @Tradytics ghost zones are shown in the screen shot below. They range from 397 - 400 currently.
The $SPY 3-day and 5-day delta correlations all favor the upside based on historical correlations between delta structure & price. However, take note of the lower volatility (no ideal for intraday traders).
Dealer delta momentum still more negative (-0.183).
Read 7 tweets

Did Thread Reader help you today?

Support us! We are indie developers!


This site is made by just two indie developers on a laptop doing marketing, support and development! Read more about the story.

Become a Premium Member ($3/month or $30/year) and get exclusive features!

Become Premium

Don't want to be a Premium member but still want to support us?

Make a small donation by buying us coffee ($5) or help with server cost ($10)

Donate via Paypal

Or Donate anonymously using crypto!

Ethereum

0xfe58350B80634f60Fa6Dc149a72b4DFbc17D341E copy

Bitcoin

3ATGMxNzCUFzxpMCHL5sWSt4DVtS8UqXpi copy

Thank you for your support!

Follow Us!

:(