It's often argued that in the absence of all-cause-mortality data to directly estimate excess deaths, we should rely on the officially reported covid-19 data. This is false, as we explain here
It is high time that countries, regions and the world report all-cause-mortality in (as close to) real time as possible.
This will help prevent future outbreaks from evolving to an epidemic and then a pandemic.
Vital Registration is VITAL.
I would like to thank the many health-workers faced with this pandemic.
My co-authors for an extremely rigorous and thoughtful research.
@OrsolaTorrisi_ and I estimate the war led to ~6,500 excess deaths among people aged 15–49:
~2,800 in Armenia
~3,400 in Azerbaijan
and 310 in de facto Artsakh.
Deaths were highly concentrated among late adolescent and young adult males, suggesting that most excess mortality was directly related to combat.
2
For small countries like Armenia (pop ~3 million) and Azerbaijan (~10 million), such loss of young men represents a considerable long-term cost for future demographic, economic, and social development.
I have officially submitted a request to retract Motallebi et al (2022) from @AmJPrevMed.
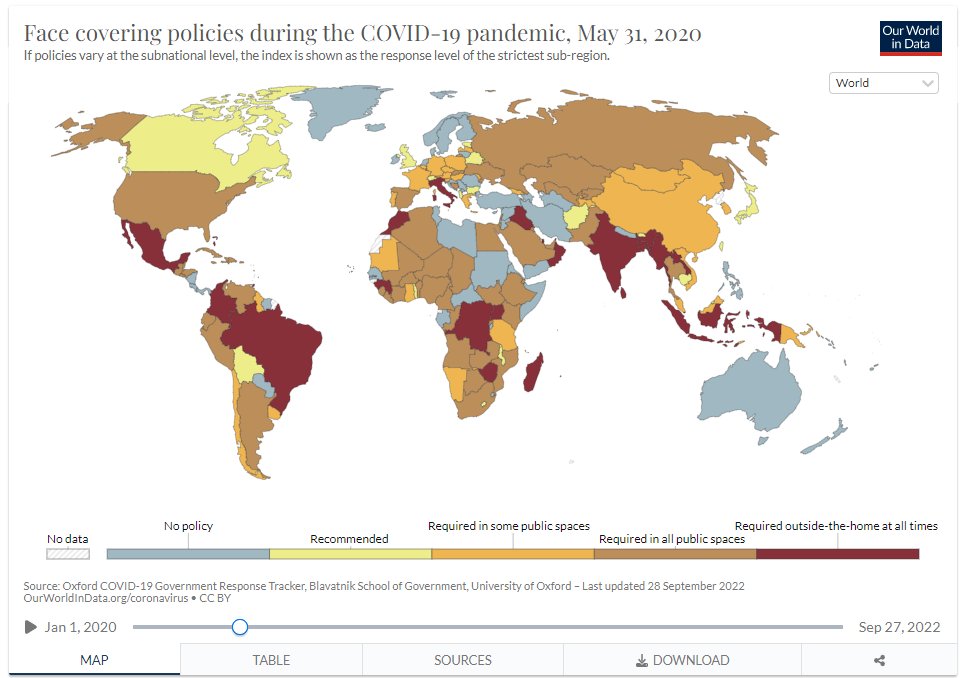
There are many conceptual and practical issues with the analysis, but the most important one is miscoding of countries into "masking yes/no" groups.
1
The paper codes Belgium, France, Italy, Spain, UK into the "no masking policy" group during the 1st COVID wave.
This is plainly false, not just by examining data on masking policies but by anyone who lives in or was in Italy for example.
2
Another issue is that the study essentially compares countries that had COVID during the 1st wave to countries without, wrongly attributing difference in deaths to policy...
This is a terrible study.
The sample period is only February 15 to May 31st 2020.
Many countries in the "yes mask policy" are countries with literally NO COVID SPREAD (as evident from both reported cases/deaths and lack of excess mortality)...
PM contains data which doesn't fit into World Mortality or Local Mortality for various reasons such as time format (not weekly, monthly or quarterly), un-official status, projections, early releases of more detailed data forthcoming, etc.
Each datum source, properties and limitations is listed below. As the time format varies substantially, each source is provided as a separate csv file.
אני רואה ששוב ושוב מפיצים את התרשים מהמחקר שלנו בנוגע להתחלקות הוצאות מדינה ומיסים על פני משקי בית בישראל.
זה מאוד מחמם את הלב אבל אשמח אם תזכרו שהוא טרם פורסם ועד ייתכנו בו שינויים, אם כי התמונה הגדולה לא תשתנה הרבה.
1
אישית אני חושב שזה אחד המחקרים החשובים ביותר שעבדתי עליהם ואני שמח לראות שיש לו תהודה גדולה עוד לפני שפורסם.
מאז שעזבתי את קהלת לכבוד הדוקטורט לקחו את המושכות שלו ביתר חבריי לפורום ולגבי השאלה "מתי תפרסמו" התשובה היא "when it's ready".
2
הסבר קטן לגבי מה רואים פה:
המחקר אומד על בסיס סקר הוצ' משק הבית את תשלומי משקי הבית על מס הכנסה, דמי ביטוח לאומי ובריאות (גם "חלק מעסיק", שאינו מופיע ישירות בסקר ונאמד בעזרת ההכנסה ברוטו מעבודה ולוחות הניכוי של המוסד לבט"ל)...
קצת יותר מאמלק: לא, הפער הוא לא "30% פחות לאותה משרה באותו היקף". לא, הפער אינו "מוסבר לחלוטין ואין דבר כזה אפליה נגד נשים".
בואו נצלול קצת לדמיון ולמודלים🧵
קודם כל - מאיפה מגיע "30%"? כמו שפוקס (2016) מראה, לוקחים את השכר הממוצע של כל הגברים השכירים, את השכר הממוצע של כל הנשים השכירות, מחלקים את השכר של הנשים בזה של הגברים וקיבלנו בערך 70%, ולכן הפער הוא 30%.
זה פשוט הפער בין השכר הממוצע של כל הגברים השכירים לכל הנשים השכירות.
האם זה אומר לנו משהו על אפליה? לאו דווקא ואולי אפילו ממש לא. למשל, במחקר שלי אני מראה שפער השכר בין גברים חרדים לגברים יהודים לא-חרדים עומד על 45%. האם הוא נובע מאפליה?