1/7 #China activity indicators for Nov came in much weaker than expected on Covid-linked restrictions and protests
. Too early for easing property measures to have an impact: floor space started remained at 13-year lows and residential demand is back to new cyclical lows
thread
2/7 . Overall construction activity was unchanged at cyclical lows and 24% below pre-pandemic trend while bottoming out on a y/y basis (-9.3% y/y vs -14.2% in Aug)
3/7 √ #China home prices fell for an 8th consecutive month, down 2.3% y/y, with 23 of cities having rising prices (up from 15% in Oct)
4/7 
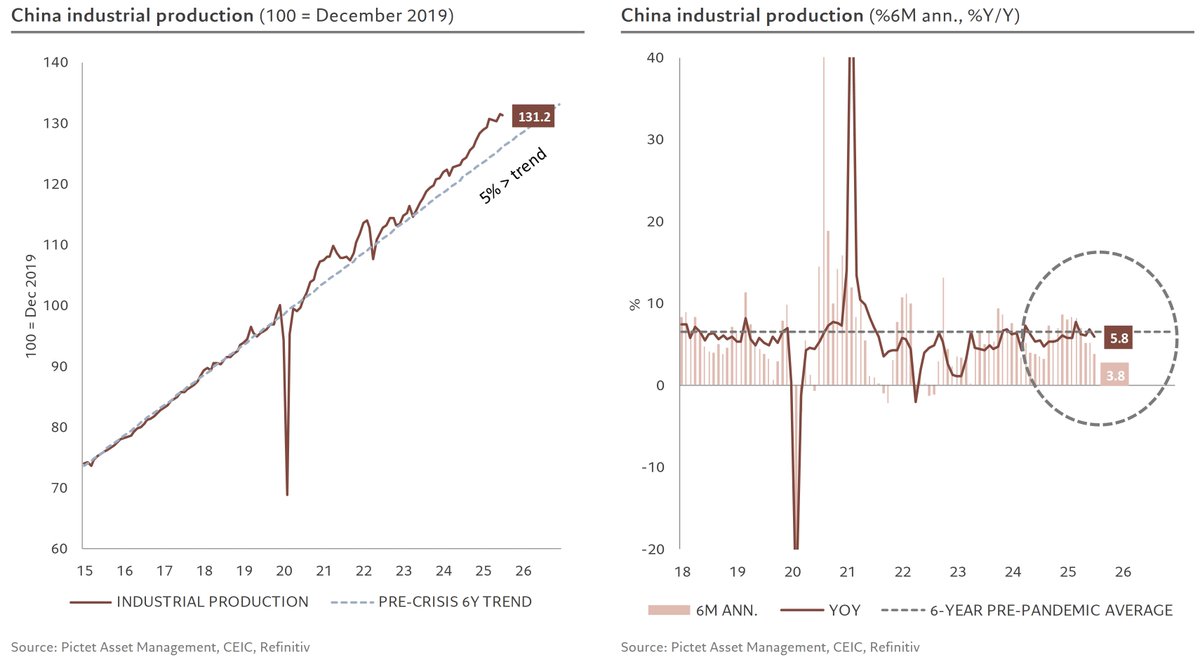
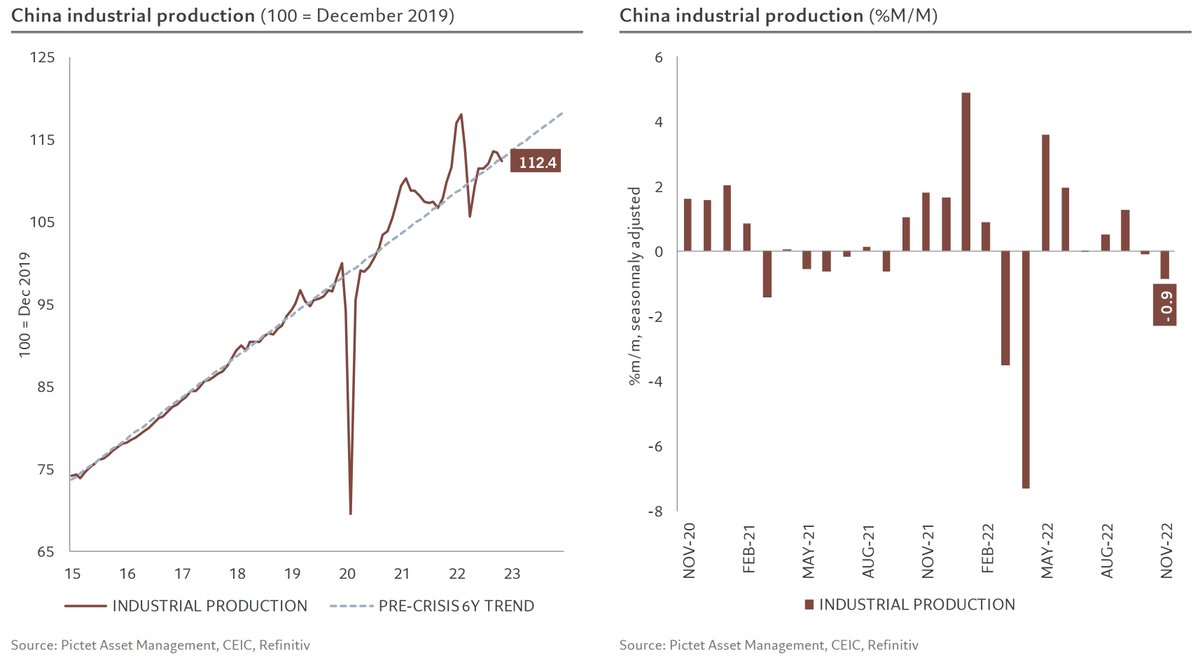
√ Industrial production declined over the month, but remains resilient as it has continued to move around trend
5/7 
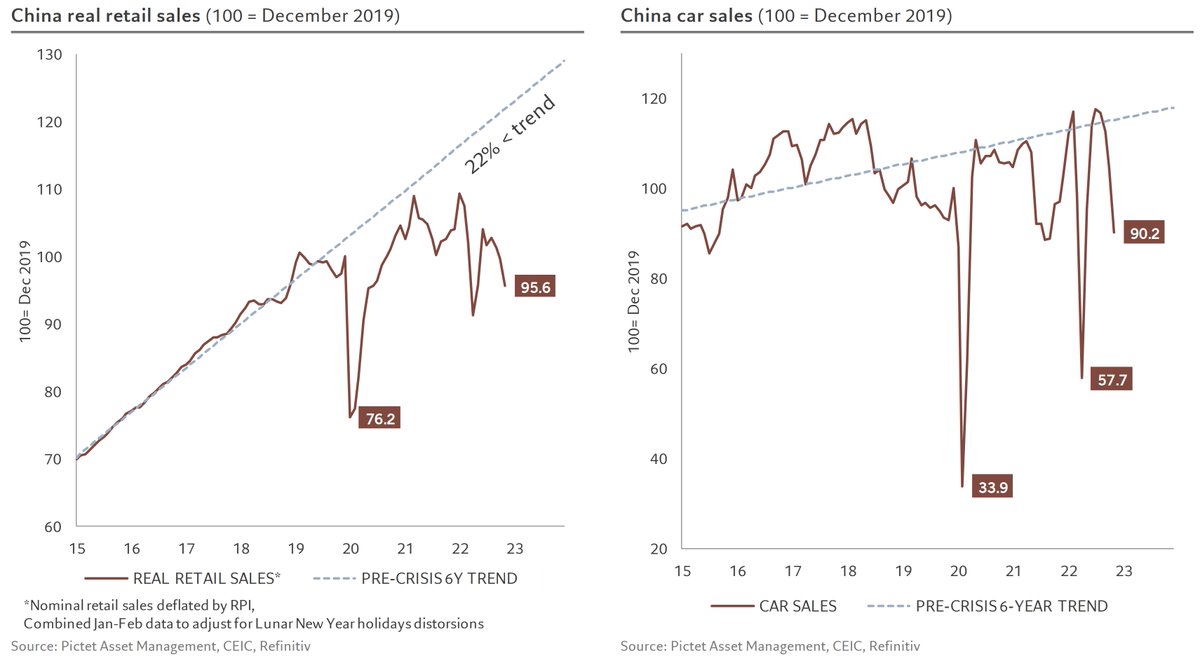
√ Real retail sales fell even further, to almost 5% below the pre-pandemic level and standing at 22% below trend
√ The only encouraging thing is that the 22% below trend gives an idea of how much pent-up demand is there when the economy finally reopens
6/7 
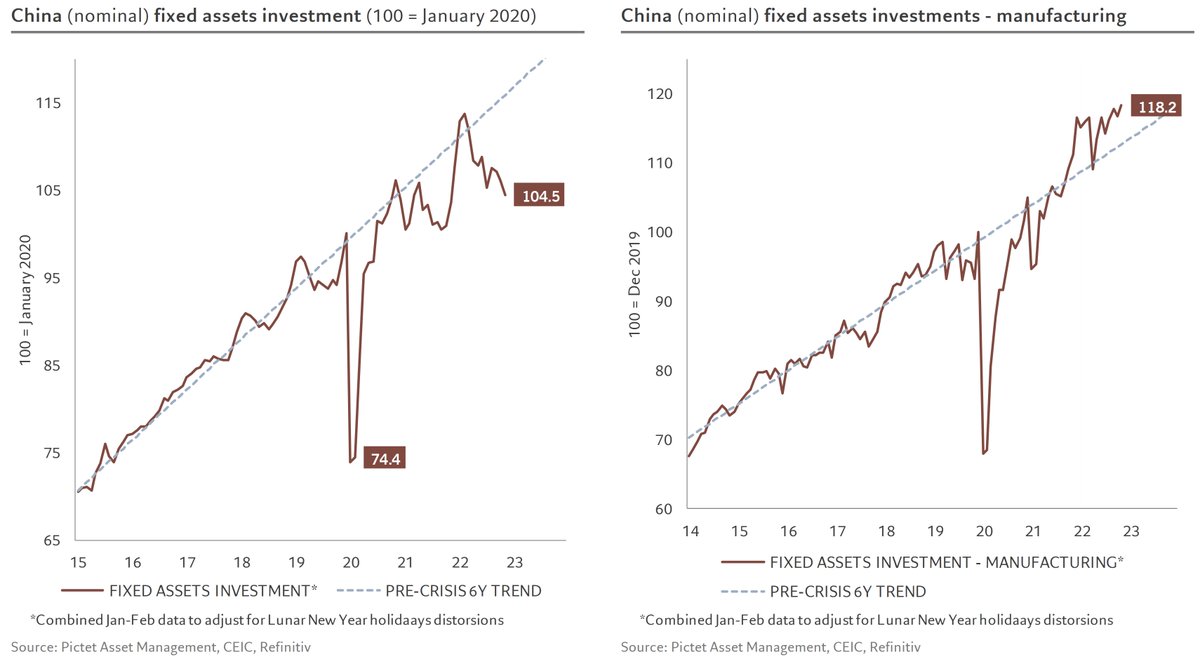
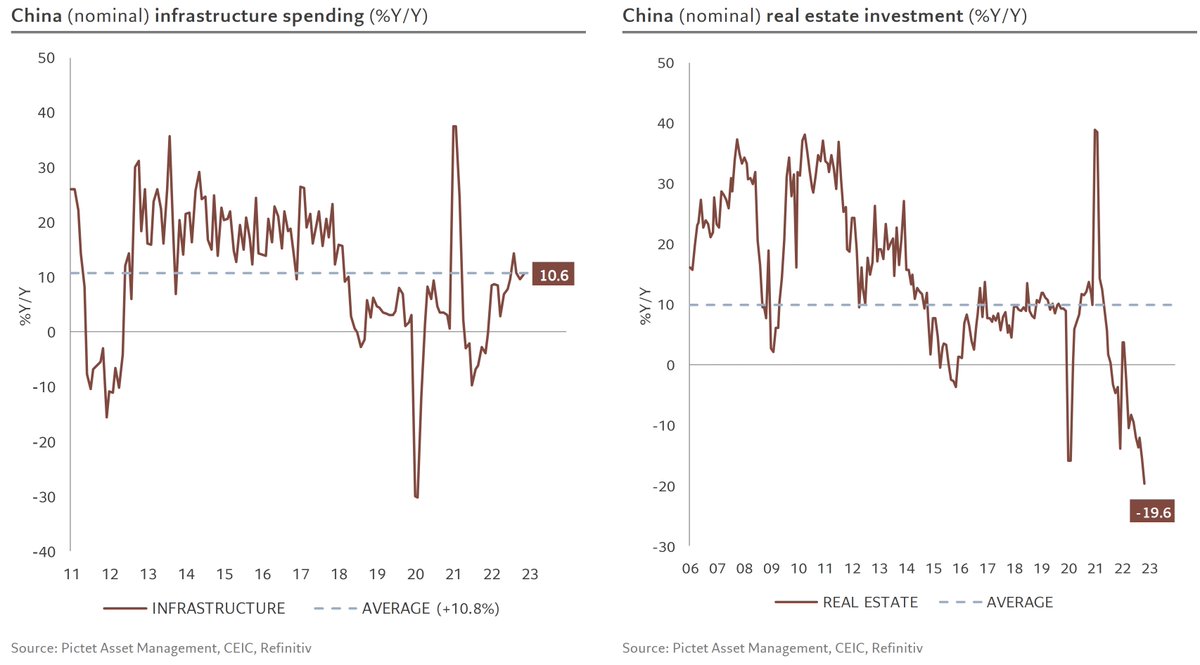
√ Fixed assets investment was also in contraction with manufacturing investment still rather resilient…
7/7 … the other components still show solid growth in infrastructure spending on the one hand, and on the other hand investment plunging at a rate not seen since the beginning of the series (mid-90s)
• • •
Missing some Tweet in this thread? You can try to
force a refresh
1/ Chinese activity in March exceeded expectations, providing strong momentum for the trade war with the US and reducing the urgency for fiscal support
GDP has returned above its pre-pandemic trend with two consecutive quarters of growth above potential: nearly 8% in Q4 2024 and 6% in Q1 2025
2/ On the supply side, industrial production has continued to drive activity, running 5% above its pre-pandemic trend and showing an annualized 6-month growth of 8.5%, which is 2 percentage points above its pre-2020 average
3/ External demand remained a strong support, with export volumes up over 11% y/y in Q1. However, US demand, which could have surged in anticipation of higher tariffs on Chinese goods, remained restrained
1/ After 2 months of better activity data in September and October, the gradual recovery continues into November. The main private demand indicators combined with PMI surveys show a recovery in our nowcast GDP growth in Q4 to 8.1% from 2% in Q3
2/ Industrial production remains solid, growing at an above-average rate of close to 9% over 3-month annualised, above its pre-pandemic trend
3/ For the 3rd month in a row, retail sales volumes rebounded from the disappointing summer months, bringing 3-month growth to over 14% annualized, but keeping the annual variation at less spectacular levels of around 3%
1/ Chinese activity data for June generally came in below expectations and slowed, as did GDP growth, which fell to 4% q/q ann. in Q2 from 6.6% in Q1. Taken together, these 2 quarters still point to growth in line with the Chinese authorities' target of around 5%.
2/ Retail sales volumes contributed to the slowdown, as they contracted in June, leading to a Q2 contraction of 0.9% q/q ann.
3/ That said, total consumer spending, which includes services, continues to be the main driver of Chinese activity, evolving only a few 2% below its pre-pandemic trend, with growth for the quarter of 4.8% ann., albeit decelerating sharply since Q1 (13%).
1/ US Core inflation was much better than expected, down to 3.3% y/y and a m/m rise of 0.8% once annualized, the 2nd consecutive month below 2% and the lowest since May 2020
The decline stems from the continued contraction in goods prices and to a decline in services inflation
2/ The fall in goods prices is explained by a contraction in demand for goods, since retail sales in volume have been declining for 3 years, falling by 3.8% since the April 2021 peak
3/ The fall in services inflation to 5.0% stems from both the continued decline in rental inflation and, for the 2nd month in a row, in services inflation excluding rents, which fell from 5.5% to 4.7% over 6 months on an annualized basis. The best news for the Fed
Since their introduction as an asset class in 1988, EM equities have outperformed developed markets (10.1% ann. vs 8.9%). But it has been a bumpy ride, with a couple of long cycles in the interim
2/ One of the most salient features of EM in that period was the variability among the asset class’s national equity markets in how they responded to economic factors.
EM outperformance was indeed driven by a very diverse group of 10 countries
3/ EM equity markets are significantly more correlated with each other, including developed market equities, than they are with other asset classes, but …
1/ US core #inflation came out in line with expectations, down to 3.6% y/y from 3.8%
The decline stems from the continued contraction in goods prices to -1.2% y/y from -0.7%, while services inflation is unchanged at 5.3%.
2/ The fall in the price of goods is justified by demand, since retail sales in volume have been declining for 3 years, falling by an annualized 0.7% since the Nov 2021 peak
3/ Stable inflation at 5.3% is due partly to the continuing fall in rental inflation and partly to the continuing rise in inflation in the non-rent component, which on a 6-month annualized basis stands at 6.5% ... still worrying for the Fed