
THREAD: 19 Tips for a DIY mask fit test to reduce your risk of #COVID19.
H/t @amandalhu & @__philipn__
What did I miss?
H/t @amandalhu & @__philipn__
What did I miss?
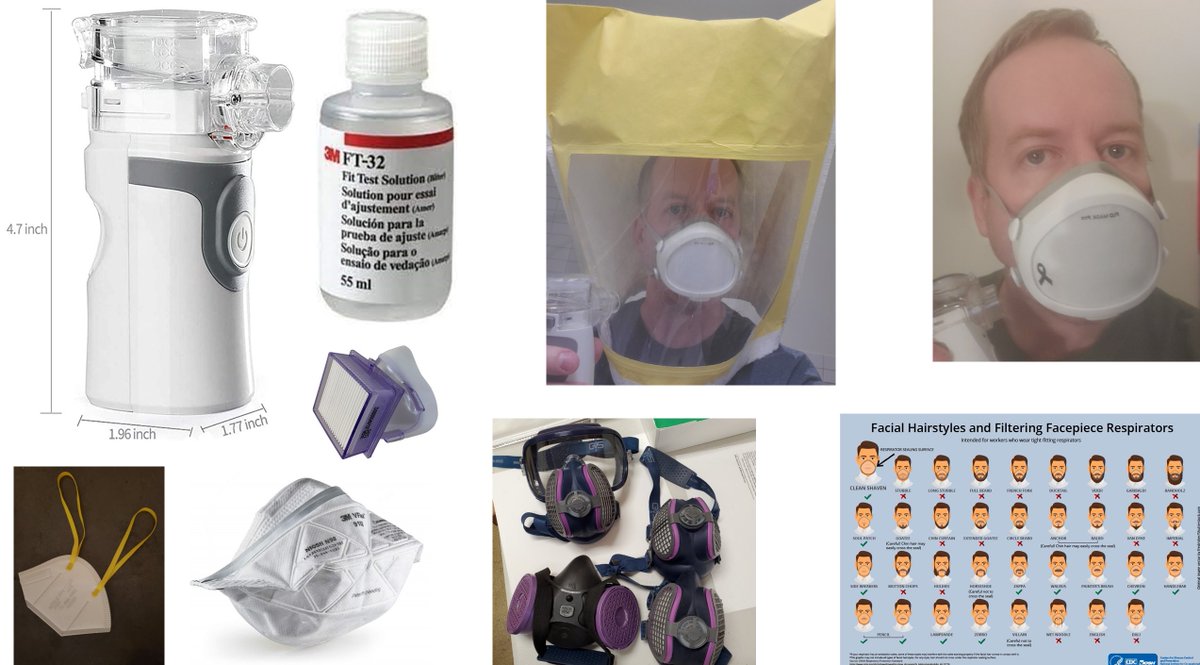
Fit-testing Tip #1: Keep it Simple.
Get a nebulizer (usually $30-40) & some 3M FT-32 Bitrex solution ($24).
Get a nebulizer (usually $30-40) & some 3M FT-32 Bitrex solution ($24).

Fit-testing Tip #2: Taste the Failure.
Use the nebulizer to spray the bitrex solution (barely visible). Breathe through your mouth. If you taste it, there’s a mask leak.
"It’s not rocket science," as @CorsIAQ likes to say.
Use the nebulizer to spray the bitrex solution (barely visible). Breathe through your mouth. If you taste it, there’s a mask leak.
"It’s not rocket science," as @CorsIAQ likes to say.
Fit-testing Tip #3: Spray at Problem Areas.
I use the nebulizer to spray bitrex fit-testing solution all around the nose bridge, by both cheeks, and under the chin.
You’ll quickly taste a leak.
I use the nebulizer to spray bitrex fit-testing solution all around the nose bridge, by both cheeks, and under the chin.
You’ll quickly taste a leak.

Fit-testing Tip #4: Go Hoodless.
Do what ya wanna, but for DIY fit testing, the method above works fine w/o the hood.
I bought a hood – overpriced! Plus, the goal is to get as many people as possible fit testing. Many would find them off-putting or feel claustrophobic.
Do what ya wanna, but for DIY fit testing, the method above works fine w/o the hood.
I bought a hood – overpriced! Plus, the goal is to get as many people as possible fit testing. Many would find them off-putting or feel claustrophobic.

Fit-testing Tip #5: Don’t Test around Maskless People/Animals.
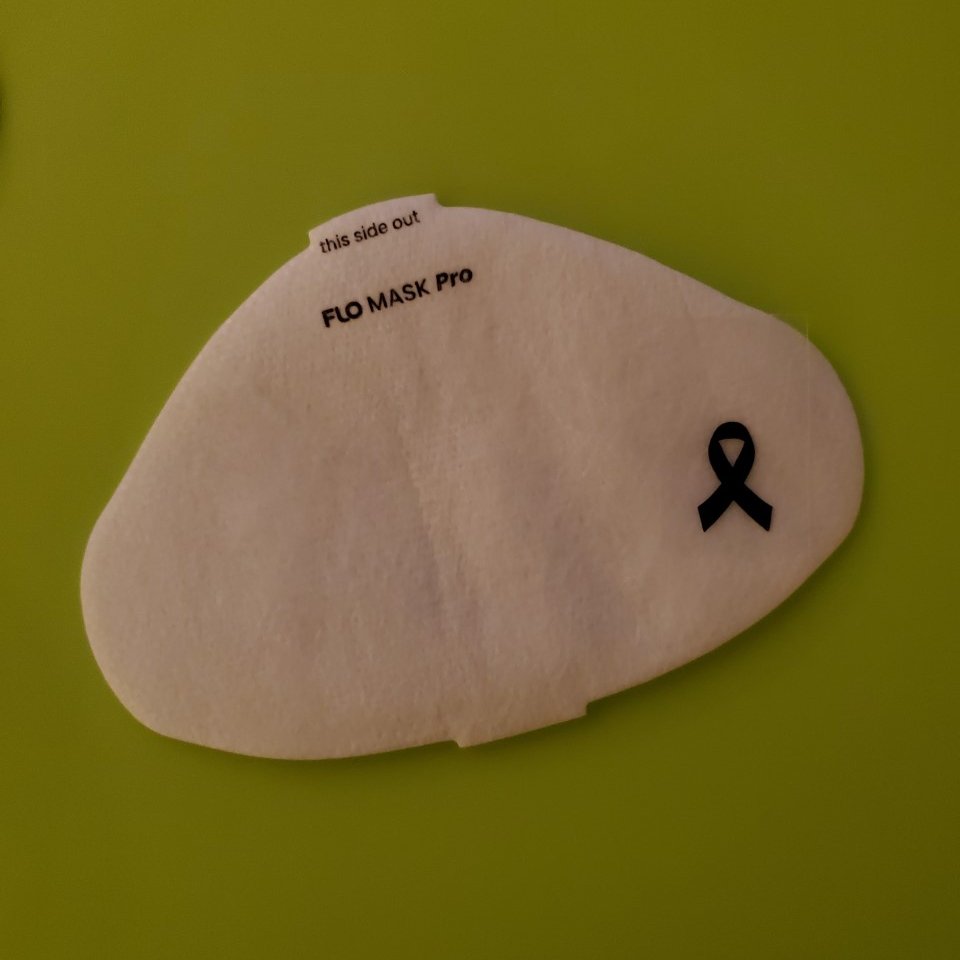
After reinstalling a new filter on my Flo Mask, I did a fit test while my son was having a bath. He started coughing. For a moment, I worried he had COVID.
Put 2&2 together, cranked up the HEPA & gave him juice.
After reinstalling a new filter on my Flo Mask, I did a fit test while my son was having a bath. He started coughing. For a moment, I worried he had COVID.
Put 2&2 together, cranked up the HEPA & gave him juice.
Fit-testing Tip #6: Have a Beverage Handy.
You’re testing for leaks. You will find some. The bitrex tastes horrible, like licking a rubber band. Have some OJ or a soda ready for after you’re done.
You’re testing for leaks. You will find some. The bitrex tastes horrible, like licking a rubber band. Have some OJ or a soda ready for after you’re done.
Fit-testing Tip #7: Share the Wealth.
Supplies cost $60 total. It takes hardly any fit-testing solution to test, so offer the opportunity to friends, family, or co-workers. You’ll help protect their health & better cocoon yourself from illness too.
Wise investment.
Supplies cost $60 total. It takes hardly any fit-testing solution to test, so offer the opportunity to friends, family, or co-workers. You’ll help protect their health & better cocoon yourself from illness too.
Wise investment.

Fit-testing Tip #8: Wear and N95 or #BetterMask.
I tested all 3 of my favorite N95s: the Aegle flat-fold, 3M Aura, and 3M VFlex. I could pass a fit test with each, some caveats noted later.
I tested all 3 of my favorite N95s: the Aegle flat-fold, 3M Aura, and 3M VFlex. I could pass a fit test with each, some caveats noted later.

Fit-testing Tip #9: Select the Best N95 for YOUR Face.
If you have several masks, test and compare. Go with the winner.
For me, the 3M VFlex held up most robustly. The 3M Aura needs to be readjusted if I talk to much. The Aegle is harder to seal at the nose.
If you have several masks, test and compare. Go with the winner.
For me, the 3M VFlex held up most robustly. The 3M Aura needs to be readjusted if I talk to much. The Aegle is harder to seal at the nose.

Fit-testing Tip #10: Get your best N95 to fit better.
Although the 3M VFlex most easily & robustly passed fit-testing, I realized I hadn’t been pulling it back far enough under the chin (@jasmith_yorku). I also learned how best to adjust the nose piece to get the best fit.
Although the 3M VFlex most easily & robustly passed fit-testing, I realized I hadn’t been pulling it back far enough under the chin (@jasmith_yorku). I also learned how best to adjust the nose piece to get the best fit.

Fit-testing Tip #11: Elastomeric Masks beat N95s.
I tested 6 elastomeric masks. I hate the word “elastomeric.” It’s alienating.
They’re just non-disposable, reusable masks. Great seal. All outperformed my disposable N95s when testing the limits.
I tested 6 elastomeric masks. I hate the word “elastomeric.” It’s alienating.
They’re just non-disposable, reusable masks. Great seal. All outperformed my disposable N95s when testing the limits.

Fit-testing Tip #12: Get your Elastomeric to Fit Better.
Straps can wear out or loosen over time! Filters also need to be reinstalled properly. Use fit testing periodically and when installing new filters to confirm no leaks.
Straps can wear out or loosen over time! Filters also need to be reinstalled properly. Use fit testing periodically and when installing new filters to confirm no leaks.
Fit-testing Tip #13: Procedure Masks are a Joke.
Fit tested, fails in <0.5 sec. Air flows to the path of least resistance. Gaps poorly guard against inhaling/exhaling viral-laden aerosols.
Everybody should be using #BetterMasks, paid w/public funds.
Fit tested, fails in <0.5 sec. Air flows to the path of least resistance. Gaps poorly guard against inhaling/exhaling viral-laden aerosols.
Everybody should be using #BetterMasks, paid w/public funds.
https://twitter.com/DrEricDing/status/1425509411267690500
Fit-testing Tip #14: Cloth Masks are ALSO a Joke.
Also tested a cloth mask. Fails in <0.5 sec. Viral-laden aerosols are too small. Not good enough for 2022.
Everybody should be using #BetterMasks, paid w/public funds.
Also tested a cloth mask. Fails in <0.5 sec. Viral-laden aerosols are too small. Not good enough for 2022.
Everybody should be using #BetterMasks, paid w/public funds.
https://twitter.com/masknerd/status/1426622693638557698
Fit-testing Tip #15: Fit-test Ear-Loop Masks.
I don't wear ear-loop masks (many KN95/KF94). My experience fit-testing makes me skeptical of cheek gaps.
Worrisome if spending much time in a poorly-ventilated space (car, plane, school, office).
I don't wear ear-loop masks (many KN95/KF94). My experience fit-testing makes me skeptical of cheek gaps.
Worrisome if spending much time in a poorly-ventilated space (car, plane, school, office).
https://twitter.com/ghhughes/status/1518106519086108673
Fit-testing Tip #16: Check for Counterfeits.
Many KN95/KF94 masks are counterfeits, especially on Amazon. Even the city of New Orleans distributed fakes “N95s” last winter. Use fit-testing to check whether a mask is legitimate.
thelensnola.org/2022/01/14/cit…
Many KN95/KF94 masks are counterfeits, especially on Amazon. Even the city of New Orleans distributed fakes “N95s” last winter. Use fit-testing to check whether a mask is legitimate.
thelensnola.org/2022/01/14/cit…
Fit-testing Tip #17: Facial Hair is a COVID Risk.
My disposable N95s start to fail fit-testing after about 2.5 days w/o shaving. My elastos make it about 3.5 days. If you’re clean-shavin, keep it clean.
If you prefer facial hair, use a mask-safe cut, or know the risk.
My disposable N95s start to fail fit-testing after about 2.5 days w/o shaving. My elastos make it about 3.5 days. If you’re clean-shavin, keep it clean.
If you prefer facial hair, use a mask-safe cut, or know the risk.

Fit-testing Tip #18: DBAA.
No, fit-testing is not REQUIRED for masks to “work.”
It’s about improving safety on the margins (5-10%) and especially for the most dangerous prolonged contexts.
osha.gov/laws-regs/stan….
No, fit-testing is not REQUIRED for masks to “work.”
It’s about improving safety on the margins (5-10%) and especially for the most dangerous prolonged contexts.
osha.gov/laws-regs/stan….

Fit-testing Tip #19: Who to Follow.
H/t to @amandalhu and @__philipn__ for teaching me about fit testing!
H/t to @amandalhu and @__philipn__ for teaching me about fit testing!
https://twitter.com/amandalhu/status/1523404690423095296
https://twitter.com/__philipn__/status/1523517311415513090
FYI, I have no conflicts of interest, such as investing in one of the companies mentioned.
I’m a psychologist just trying to help people understand COVID mitigation tips I didn’t know a year ago so maybe you can reduce your lifetime number of cumulative SARS-CoV-2 infections.
I’m a psychologist just trying to help people understand COVID mitigation tips I didn’t know a year ago so maybe you can reduce your lifetime number of cumulative SARS-CoV-2 infections.
• • •
Missing some Tweet in this thread? You can try to
force a refresh


