SalehTrades Profile picture
Dec 25, 2022 8 tweets 3 min read Read on X
🚨 Here's a Twitter thread explaining the 200EMA (200-day exponential moving average) and how to use it: #200EMA
1. The 200EMA is a popular technical analysis indicator that helps traders and investors identify trends in the market. It is calculated by taking the average closing price of a security over the past 200 days and applying an exponential weighting to it.
2. The 200EMA is often used as a longterm trend indicator, as it smooths out the noise in the price data and helps to identify the overall trend of the market. If the price is above the 200EMA, it is considered an uptrend. If the price is below the 200EMA, it is considered a DT Image
3. In addition to identifying trends, the 200EMA can also be used as a support or resistance level. If the price bounces off the 200EMA, it may be an indication that the trend is likely to continue. If the price breaks through the 200EMA, it may indicate a change in trend. Image
4. One important thing to keep in mind is that the 200EMA is a lagging indicator, meaning it is based on past price data and may not always accurately predict future price movements. It is important to use the 200EMA with other technical indicators and analysis techniques.
5. To use the 200EMA, you will need access to a charting platform that allows you to plot the indicator on your price chart. Simply select the 200EMA from the list of indicators. You can then use the 200EMA as a reference point for your analysis and trading decisions. ImageImage
6. In conclusion, the 200EMA is a useful technical analysis tool for identifying trends and potential support and resistance levels. It should be used in conjunction with other indicators and analysis techniques, and traders should be aware of its lagging nature.
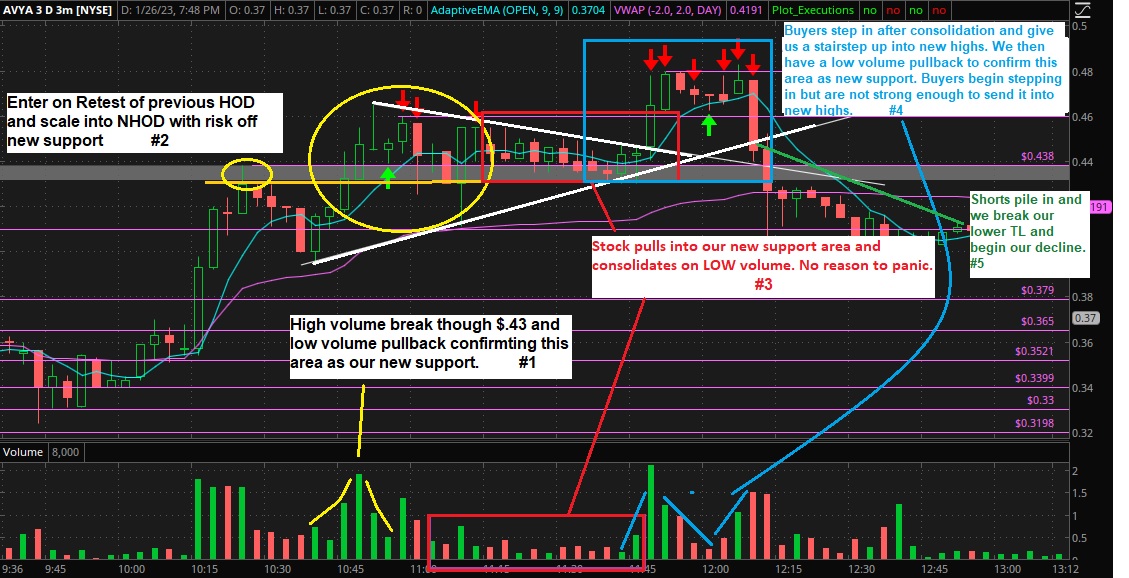
Here is another example of support and resistance using the 200EMA that couldn't be uploaded for some reason. Image

• • •

Missing some Tweet in this thread? You can try to force a refresh
 

Keep Current with SalehTrades

SalehTrades Profile picture

Stay in touch and get notified when new unrolls are available from this author!

Read all threads

This Thread may be Removed Anytime!

PDF

Twitter may remove this content at anytime! Save it as PDF for later use!

Try unrolling a thread yourself!

how to unroll video
  1. Follow @ThreadReaderApp to mention us!

  2. From a Twitter thread mention us with a keyword "unroll"
@threadreaderapp unroll

Practice here first or read more on our help page!

More from @SalehTrades_

Feb 2, 2023
🚨Recap of some trades from 1/31 and today 2/1. As always, these are straight from my personal trading journal
1. $SOUN 1/31/2023 5Min Flag + Pre Market High Pivot Image
2. $SOBR 1/31/2023 10Min Flag + Pivot Image
Read 7 tweets
Jan 31, 2023
🚨Some trading reviews from 1/30/2023, straight from my personal trading journal.
1. $HSCS 1/30/2023 10Min BullFlag + Pivot Image
2. $AEMD 1/30/2023 5Min Flag + Pivot Image
Read 5 tweets
Jan 29, 2023
🚨Recap of some trades from Friday 1/27/2023 / Straight from my personal trading journal!
1. FOXO 1/27/2023 5min Flag + 1min chart ImageImage
2. GNS 1/27/2023 5Min Flag Image
Read 7 tweets
Jan 27, 2023
🚨 Reviewed some trades from today
$AVYA 3/5min flag + Support/Resistance Image
$BIAF 10min Flag Image
Read 8 tweets
Jan 16, 2023
🚨Thread Alert! Let's talk about some chart patterns to look out for when day trading. #Chartpatterns
1. Head and Shoulders: This pattern is characterized by a peak (The "left shoulder) followed by a higher peak (the "head"), then a lower peak (the "right shoulder"). It's considered a bearish reversal pattern. Image
2. Double Tops and Bottoms: This pattern is characterized by two peaks (or bottoms) at roughly the same price level. It's considered a reversal pattern, with a double top being bearish and a double bottom being bullish. Image
Read 8 tweets
Jan 14, 2023
🚨 Reviewing your day trades is an important step toward becoming a successful day trader. It enables you to identify what worked well and what did not, allowing you to make changes and improve your performance. #Reviewing #Review
1. Analyzing your entry and exit points as well as the reasons behind each trade should be part of a thorough review. This will enable you to spot any patterns or errors in your decision-making. Review, Review, and Review.
2. it's also important to review your risk management strategies and determine whether they were effective in minimizing losses and maximizing profits. Although a 1/2 R/R is typical, you should always aim for more return and decreased risk.
Read 7 tweets

Did Thread Reader help you today?

Support us! We are indie developers!


This site is made by just two indie developers on a laptop doing marketing, support and development! Read more about the story.

Become a Premium Member ($3/month or $30/year) and get exclusive features!

Become Premium

Don't want to be a Premium member but still want to support us?

Make a small donation by buying us coffee ($5) or help with server cost ($10)

Donate via Paypal

Or Donate anonymously using crypto!

Ethereum

0xfe58350B80634f60Fa6Dc149a72b4DFbc17D341E copy

Bitcoin

3ATGMxNzCUFzxpMCHL5sWSt4DVtS8UqXpi copy

Thank you for your support!

Follow Us!

:(