All tweets are opinions. This is my only account. ᴅɪꜱᴄᴏʀᴅ: ꜱᴀʟᴇʜᴛʀᴀᴅᴇꜱ_#6600 / Discord in Linktree 👇
Feb 2, 2023 • 7 tweets • 2 min read
🚨Recap of some trades from 1/31 and today 2/1. As always, these are straight from my personal trading journal
1. $SOUN 1/31/2023 5Min Flag + Pre Market High Pivot
Jan 31, 2023 • 5 tweets • 1 min read
🚨Some trading reviews from 1/30/2023, straight from my personal trading journal.
1. $HSCS 1/30/2023 10Min BullFlag + Pivot
Jan 29, 2023 • 7 tweets • 2 min read
🚨Recap of some trades from Friday 1/27/2023 / Straight from my personal trading journal!
1. FOXO 1/27/2023 5min Flag + 1min chart
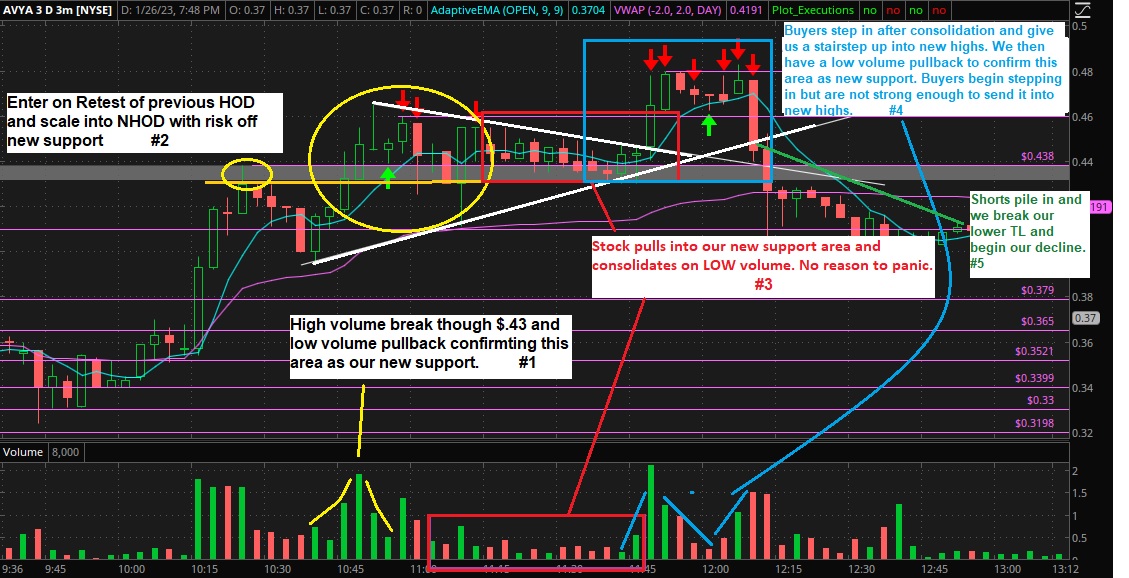
Jan 27, 2023 • 8 tweets • 2 min read
🚨 Reviewed some trades from today
$AVYA 3/5min flag + Support/Resistance
Jan 16, 2023 • 8 tweets • 3 min read
🚨Thread Alert! Let's talk about some chart patterns to look out for when day trading. #Chartpatterns1. Head and Shoulders: This pattern is characterized by a peak (The "left shoulder) followed by a higher peak (the "head"), then a lower peak (the "right shoulder"). It's considered a bearish reversal pattern.
Jan 14, 2023 • 7 tweets • 2 min read
🚨 Reviewing your day trades is an important step toward becoming a successful day trader. It enables you to identify what worked well and what did not, allowing you to make changes and improve your performance. #Reviewing#Review1. Analyzing your entry and exit points as well as the reasons behind each trade should be part of a thorough review. This will enable you to spot any patterns or errors in your decision-making. Review, Review, and Review.
Jan 14, 2023 • 7 tweets • 2 min read
🚨 Day trading in the stock market can be a great way to make money, but it also comes with a high level of risk. As a beginner, it's important to understand how to manage that risk effectively. #RiskManagement1. Setting an appropriate risk-to-reward ratio for your trades should be one of your first priorities. This entails setting a target profit that is at least twice as much as the maximum you're willing to lose on a trade. 1/2 R/R.
Dec 26, 2022 • 8 tweets • 2 min read
🚨 Here is a Twitter thread explaining the EMA9 and how to use it in day trading:
1. The EMA9 is a technical indicator that shows the average price of a stock or other financial asset over a period of 9 days. It is calculated by applying a weighting factor to the most recent prices, so that more recent prices have a greater influence on the average.
Dec 26, 2022 • 8 tweets • 1 min read
🚨 Trading psychology is an important aspect of success in the stock market. Here are a few tips for improving your trading psychology:
1. Set clear goals and stick to a plan. Having a clear idea of what you want to achieve and how you will get there can help you stay focused and avoid making impulsive decisions.
Dec 25, 2022 • 8 tweets • 3 min read
🚨 Here's a Twitter thread explaining the 200EMA (200-day exponential moving average) and how to use it: #200EMA1. The 200EMA is a popular technical analysis indicator that helps traders and investors identify trends in the market. It is calculated by taking the average closing price of a security over the past 200 days and applying an exponential weighting to it.
Dec 25, 2022 • 8 tweets • 1 min read
🚨 As a beginner day trader, it's important to be mindful of some common pitfalls that can lead to failure. Here are a few things not to do as a beginner day trader:
1. Don't invest money you can't afford to lose. Day trading can be risky, and it's important to only invest money that you can afford to lose without it causing financial stress.
Dec 24, 2022 • 12 tweets • 4 min read
🚨Lv.2 / In day trading, the bid and ask prices are important to understand, as they represent the prices at which a security can be bought or sold... --> #level2#Lv2#bid#ask
... The bid price is the highest price that a buyer is willing to pay for a security, while the ask price is the lowest price that a seller is willing to accept. The difference between the bid and ask prices is known as the spread, and it represents the cost of buying or selling.
Dec 23, 2022 • 9 tweets • 3 min read
🚨Trend lines are lines that are drawn on a stock chart to show the direction in which the price of a security is moving. #Trendlines1. They can be used to identify trends in the market and to make predictions about where the price of a security is likely to go in the future.
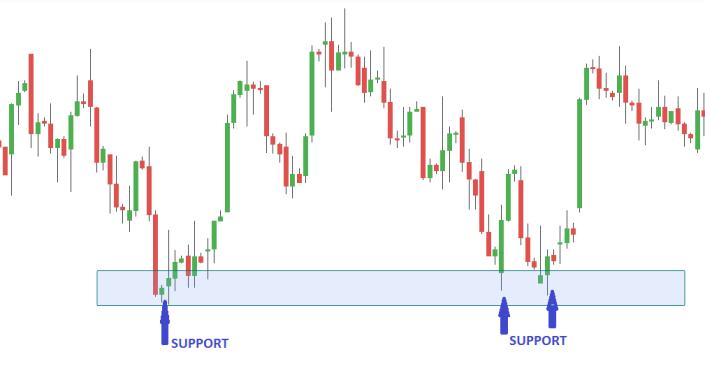
Dec 23, 2022 • 7 tweets • 3 min read
🚨 Support and resistance are key concepts in the stock market, and understanding how they work can help you make informed decisions about your investments. #Support#Resistance1. Support refers to a level at which the price of a stock tends to find difficulty falling below. This is because buyers tend to step in and purchase the stock at this level, providing support and preventing the price from falling further.