
PhD Planning Masterclass:
Have you heard of a Kanban Board?
✅ 90% of companies use this visual Japanese planning tool.
❌ Most academics, never heard of it.
Here's my project-manager-turned-phd guide.
Merge pdfs, notes & planning into a single system:
🧵⬇️
#AcademicChatter
Have you heard of a Kanban Board?
✅ 90% of companies use this visual Japanese planning tool.
❌ Most academics, never heard of it.
Here's my project-manager-turned-phd guide.
Merge pdfs, notes & planning into a single system:
🧵⬇️
#AcademicChatter
This is part 2️⃣ of the tutorial.
In the first part we made a coarse strategic plan.
In this part we are going into more detail to the level of tasks.
Here is the first "high-level" planning tutorial:
In the first part we made a coarse strategic plan.
In this part we are going into more detail to the level of tasks.
Here is the first "high-level" planning tutorial:
https://twitter.com/Artifexx/status/1608934257292103683
⚡️ Break Down your tasks
To get from strategy to action, we break down our tasks.
Subdivide until they are small & actionable.
Ideal size per task: 2-4 hrs.
An example from my PhD.
We break down the big, strategic task:
"Predicting the Future of a New Zealand Forest" 🌳
To get from strategy to action, we break down our tasks.
Subdivide until they are small & actionable.
Ideal size per task: 2-4 hrs.
An example from my PhD.
We break down the big, strategic task:
"Predicting the Future of a New Zealand Forest" 🌳

⚡️ Convert cards to notes
Our tasks are now small enough, to tackle them.
The "cards" on the canvas need to become notes.
These are displayed in the Kanban.
For better overview: Use emojis ✅ / 🟥 in the title.
The notes need to contain some meta-data (next step) to work.
Our tasks are now small enough, to tackle them.
The "cards" on the canvas need to become notes.
These are displayed in the Kanban.
For better overview: Use emojis ✅ / 🟥 in the title.
The notes need to contain some meta-data (next step) to work.
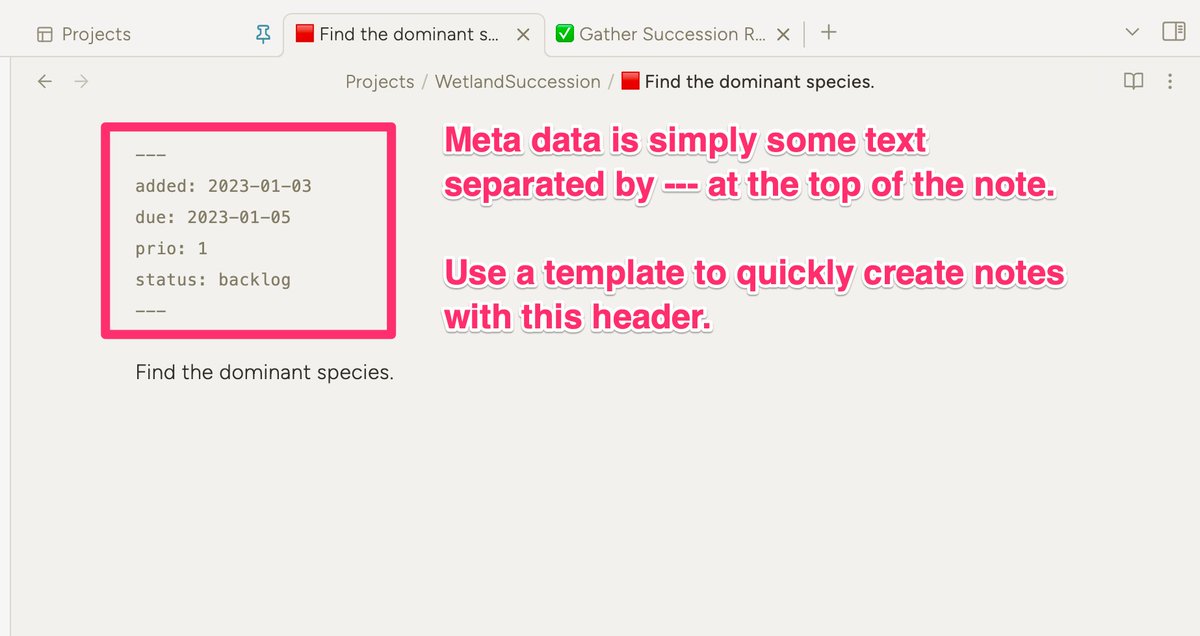
⚡️ Add Meta Data aka. Frontmatter
This is a machine readable entry at the top of your notes.
You won't see it, but plugins can read it.
Use the fields "due", "prio" and "status" for now.
The date format must be YYYY-MM-DD.
This is a machine readable entry at the top of your notes.
You won't see it, but plugins can read it.
Use the fields "due", "prio" and "status" for now.
The date format must be YYYY-MM-DD.
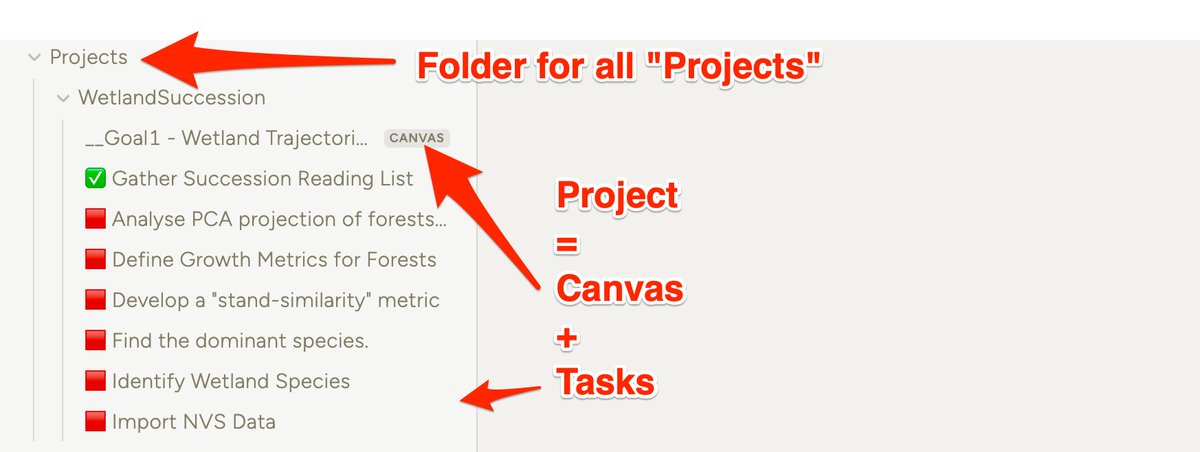
⚡️ Folder Structure
I prefer to keep my projects in a separate folder.
This way tasks from separate projects won't mix.
A project for me consists of a bunch of tasks
and our mind map (canvas) to bind them together.
I prefer to keep my projects in a separate folder.
This way tasks from separate projects won't mix.
A project for me consists of a bunch of tasks
and our mind map (canvas) to bind them together.
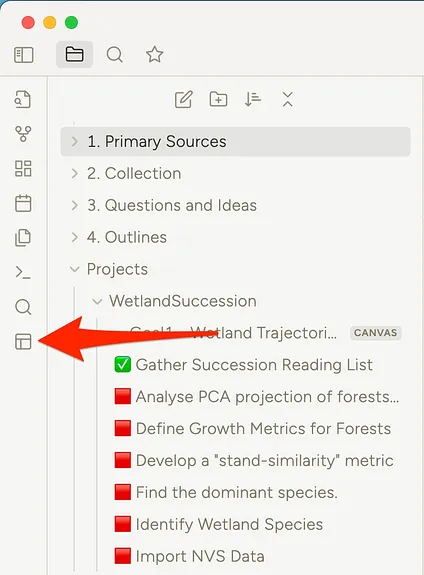
⚡️ We will use the "Projects" plugin.
Go to Settings > Community Plugins.
Search for "Projects by Marcus Olsson"
Download and install it.
Open the Project view, with the little button on the left.
Go to Settings > Community Plugins.
Search for "Projects by Marcus Olsson"
Download and install it.
Open the Project view, with the little button on the left.

⚡️ Create your first Project
Specify a path to your notes.
That is why we put the project into a separate folder.
Tasks do not mix between projects.
Optional: Make your life a bit easier by specifying a template
and a default title.
Specify a path to your notes.
That is why we put the project into a separate folder.
Tasks do not mix between projects.
Optional: Make your life a bit easier by specifying a template
and a default title.

⚡️ Using the Table View
Your notes (from the canvas) are now entries in a table.
It is like a simplified excel or google spread sheet.
It shines when you have many tasks.
You can filter and color code them.
Your columns are just the front matter fields. Add more as needed.
Your notes (from the canvas) are now entries in a table.
It is like a simplified excel or google spread sheet.
It shines when you have many tasks.
You can filter and color code them.
Your columns are just the front matter fields. Add more as needed.

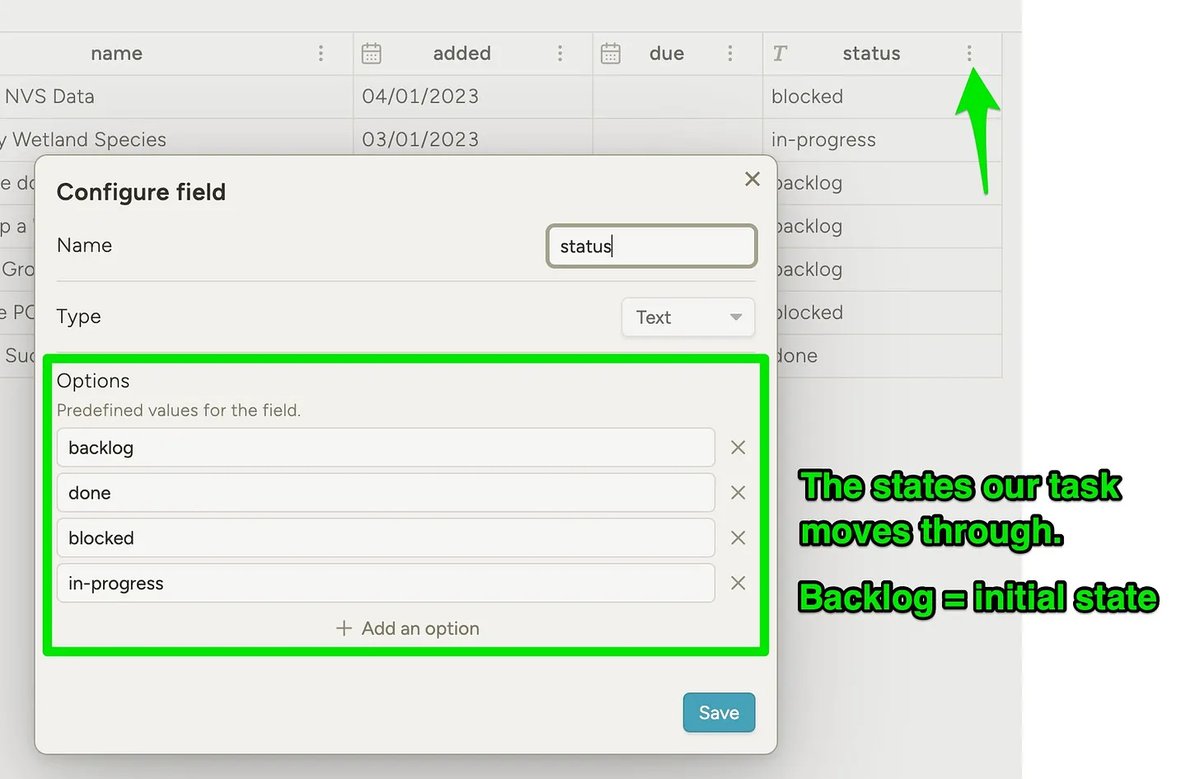
⚠️ Set values for "state"
We have not yet defined what "status" can be.
Simplest form: backlog, done, doing, blocked
Click the 3 dots next to status and add the 4 states.
We need this for our Kanban/Board view.
We have not yet defined what "status" can be.
Simplest form: backlog, done, doing, blocked
Click the 3 dots next to status and add the 4 states.
We need this for our Kanban/Board view.
⚡️ Using the Kanban/Board View
We can now create our first Kanban board!
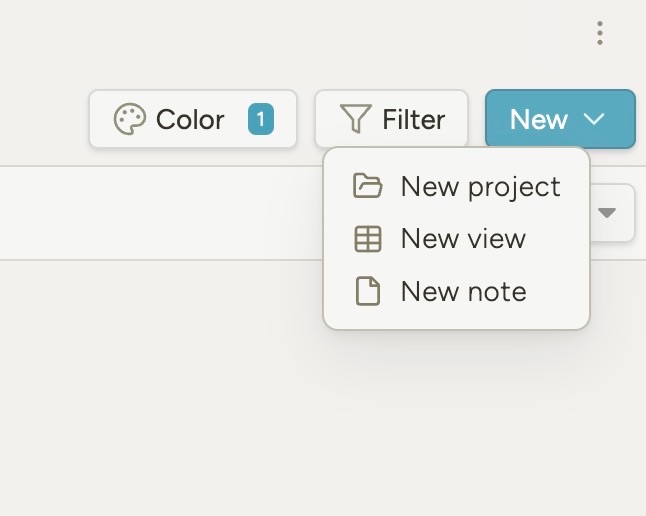
Click "new" on the top right.
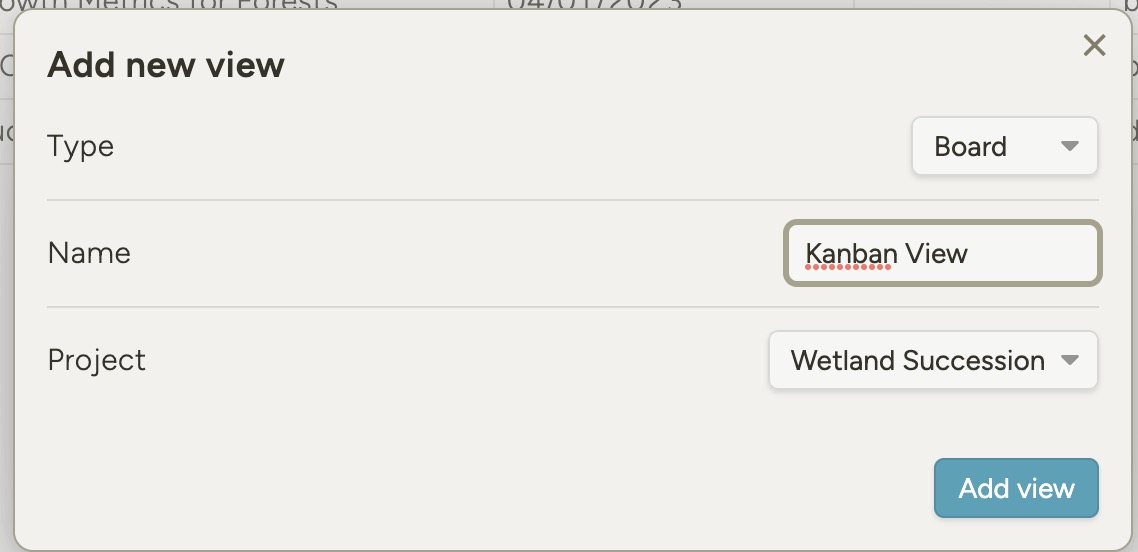
Select "Board" as type from the popup.
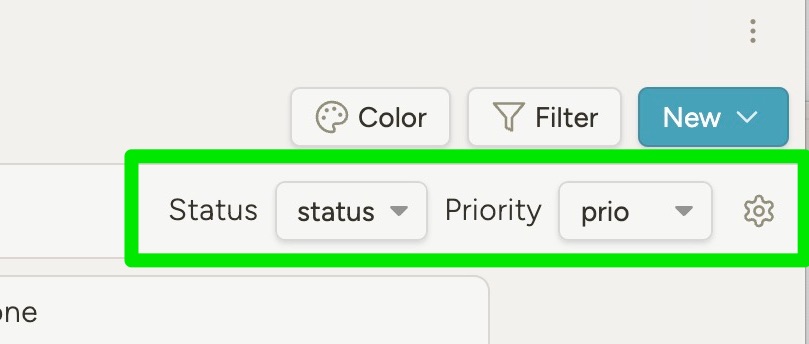
On the top left of the view: Set status and priority drop downs.
(Nothing will display until you set these)
We can now create our first Kanban board!
Click "new" on the top right.
Select "Board" as type from the popup.
On the top left of the view: Set status and priority drop downs.
(Nothing will display until you set these)
⚡️ Move tasks from left to right
Each column is the "state" of the task.
We start left: "Backlog"
We finish right: "Done"
Drag and Drop your tasks.
Use "Blocked" for tasks, where you wait on someone for example.
😵 Now you have complete overview of the project!
Each column is the "state" of the task.
We start left: "Backlog"
We finish right: "Done"
Drag and Drop your tasks.
Use "Blocked" for tasks, where you wait on someone for example.
😵 Now you have complete overview of the project!
⚡️ Use the calendar to view time-critical tasks
We now create another view: "Calendar"
Just like you did for "Board view", use the blue button at the top right.
When you created the view, set the Date dropdown to "due".
This should display your tasks as a calendar:
We now create another view: "Calendar"
Just like you did for "Board view", use the blue button at the top right.
When you created the view, set the Date dropdown to "due".
This should display your tasks as a calendar:

🚀 It is not magic
We take fields in your frontmatter,
and display them in different views.
Understand this and you unlock your creativity.
Add fields & views as desired to suit your project!
(When you complete a task, you need to manually change the 🟥 to ✅ in the title)
We take fields in your frontmatter,
and display them in different views.
Understand this and you unlock your creativity.
Add fields & views as desired to suit your project!
(When you complete a task, you need to manually change the 🟥 to ✅ in the title)
🧠 Summary
Represent tasks in 4 views:
• Mind maps: For a strategic plan
• Tables: To filter tasks
• Kanban-Boards: See the progress of the ENTIRE project.
• Calendars: Identify what's urgent.
It's your Swiss army knife of planning.
You can literally do anything with it.
Represent tasks in 4 views:
• Mind maps: For a strategic plan
• Tables: To filter tasks
• Kanban-Boards: See the progress of the ENTIRE project.
• Calendars: Identify what's urgent.
It's your Swiss army knife of planning.
You can literally do anything with it.
A lot to cover in a few tweets!
You can find a much more detailed,
beginner-friendly version in my 📩 Newsletter.
The link is in my profile.
Let your friends know ♻️, if you enjoyed this ❤️!
May your academic life,
be effortless 🕊️.
You can find a much more detailed,
beginner-friendly version in my 📩 Newsletter.
The link is in my profile.
Let your friends know ♻️, if you enjoyed this ❤️!
May your academic life,
be effortless 🕊️.
• • •
Missing some Tweet in this thread? You can try to
force a refresh


