How Often Does Go Preempt Goroutines?

The conventional wisdom says CPU-bound goroutines are preempted every 10ms, but this is wrong. #golang Image
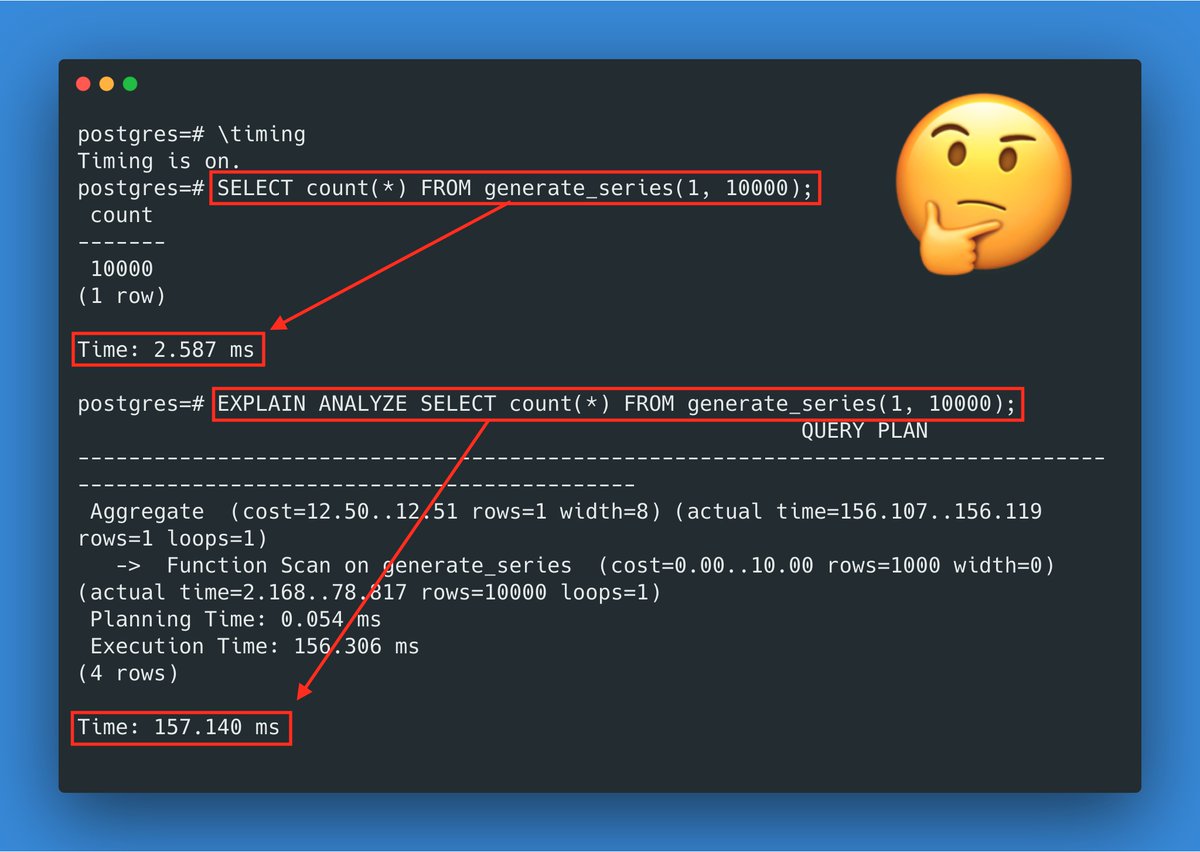
We can check this with a small test program. Image
Looking at the the runtime/trace of this program, we see that the goroutine is executed 201 times by the scheduler, with an average time of 24.8ms between preemptions. Image
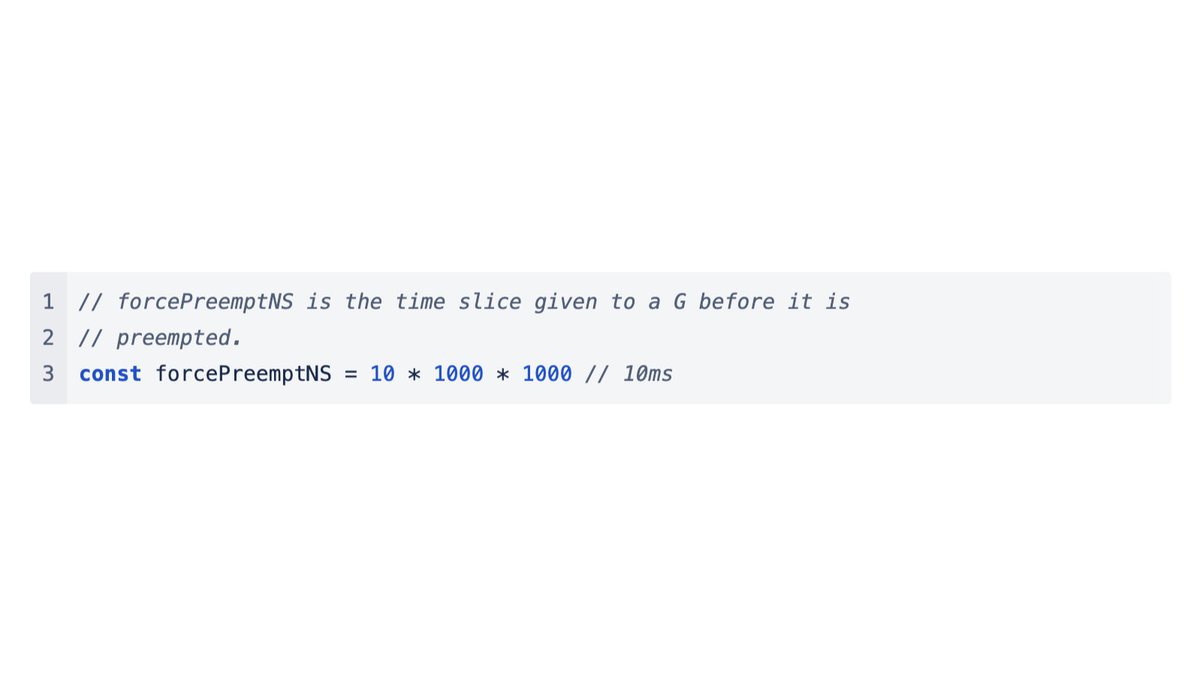
So what’s going on? At first glance proc.go seems to confirm the conventional 10ms wisdom?

github.com/golang/go/blob… Image
Following this reference leads us inside of the retake() function. As we can see, the first time a goroutine is considered for retaking (preemption), Go just captures the current time in pd.schedwhen.

github.com/golang/go/blob… Image
The reason it does this is because it doesn’t know for how long the goroutine has been running at this point. Capturing the start time for every scheduling event would probably be too much overhead.

github.com/golang/go/issu…
So let’s take a look at sysmon(), the background goroutine that is calling retake. Here we can see that it dynamically adjusts its wakeup frequency from 20usec to 10ms. In our case it’s always 10ms.

github.com/golang/go/blob… Image
Given what we’ve seen so far would explain 20ms between preemption events, but in reality we’re observing closer to 25ms. The last piece to he puzzle is usleep() itself.

man7.org/linux/man-page…
It turns out that on my macOS system, usleep(10*1000) usually sleeps for 12.5ms instead of 10ms to to resolution limitations of the underlaying system timer. Image
That's it. Thanks for reading. I don’t think the current behavior is problematic. I just went down this rabbit hole while studying runtime/trace today :)
Of course the opening tweet is click bait. 10ms isn't wrong, it's just a minimum duration which will often not be observed depending on sysmon activity and usleep precision.

• • •

Missing some Tweet in this thread? You can try to force a refresh
 

Keep Current with Felix Geisendörfer @felixge@home.social

Felix Geisendörfer @felixge@home.social Profile picture

Stay in touch and get notified when new unrolls are available from this author!

Read all threads

This Thread may be Removed Anytime!

PDF

Twitter may remove this content at anytime! Save it as PDF for later use!

Try unrolling a thread yourself!

how to unroll video
  1. Follow @ThreadReaderApp to mention us!

  2. From a Twitter thread mention us with a keyword "unroll"
@threadreaderapp unroll

Practice here first or read more on our help page!

More from @felixge

Jan 24, 2023
Big editor trying to steer windows users away from the true path. EU regulators should look into this 🤣

(If you haven't guessed, I get to debug some Go code on Windows today and we're not off to a good start here) Image
Its user interface is unintuitive and its key bindings are awkward?

That's just a libel and defamation case waiting to happen 🙈
Screw you windows - you're gonna satisfy my every vim! Image
Read 4 tweets
Jun 15, 2020
Loving this "Looking Back at Postgres" paper. So many excellent burns 🔥
Also plenty of shade for code within PostgreSQL.

(But luckily this code seems to have landed in /dev/null)
I work in the cottage industry of materialized view maintenance! I feel seen 🙈
Read 10 tweets
Jan 26, 2020
1) Are you using #postgres via #docker for mac?

Have you ever noticed `EXPLAIN ANALYZE` slowing down your queries by like 60x?

Let's dig into some #postgres and #linux internals to figure out what's going on! An accessible version of this thread is available at https://github.com/felixge/tweets/tree/master/postgres-docker-explain-analyze
1b) This thread is also available on GitHub: github.com/felixge/tweets…
2) First we need some understanding of how `EXPLAIN ANALYZE` works.

Looking through the PostgreSQL code, it basically boils down to:

start = clock_gettime()
row = node.nextRow()
node.time += clock_gettime() - start
return row
Read 22 tweets
Jan 20, 2020
1) Oh man, computer stuff is hard. A small #postgresql thread:

After spending weeks optimizing an ETL process to be 3x faster, an index-only scan got 3x slower compared to a replica that hadn't undergone the new ETL process. Main clue: (shared) buffer hits were up by 10x.
2) My initial suspicion was vacuum issues or index corruption, but no amount of `VACUUM FULL` or recreating the indexes was helping. So I had to dig deeper.

Enter dynamic tracing with perf: wiki.postgresql.org/wiki/Profiling…
3) After some studying of the PostgreSQL source, I decided that ReadBufferExtended would be a good function to trace in order to figure out the big increase in buffer hits/allocs.

github.com/postgres/postg…
Read 12 tweets

Did Thread Reader help you today?

Support us! We are indie developers!


This site is made by just two indie developers on a laptop doing marketing, support and development! Read more about the story.

Become a Premium Member ($3/month or $30/year) and get exclusive features!

Become Premium

Don't want to be a Premium member but still want to support us?

Make a small donation by buying us coffee ($5) or help with server cost ($10)

Donate via Paypal

Or Donate anonymously using crypto!

Ethereum

0xfe58350B80634f60Fa6Dc149a72b4DFbc17D341E copy

Bitcoin

3ATGMxNzCUFzxpMCHL5sWSt4DVtS8UqXpi copy

Thank you for your support!

Follow Us!

:(