Bullish Engulfing Candlestick Pattern. 📈
How should you trade the with this pattern?
Entry & Exit?
A THREAD 🧵
(1/10)
#StockMarketindia #trading #StockMarket
How should you trade the with this pattern?
Entry & Exit?
A THREAD 🧵
(1/10)
#StockMarketindia #trading #StockMarket
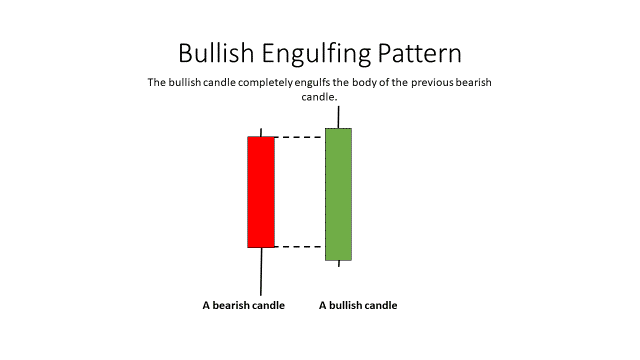
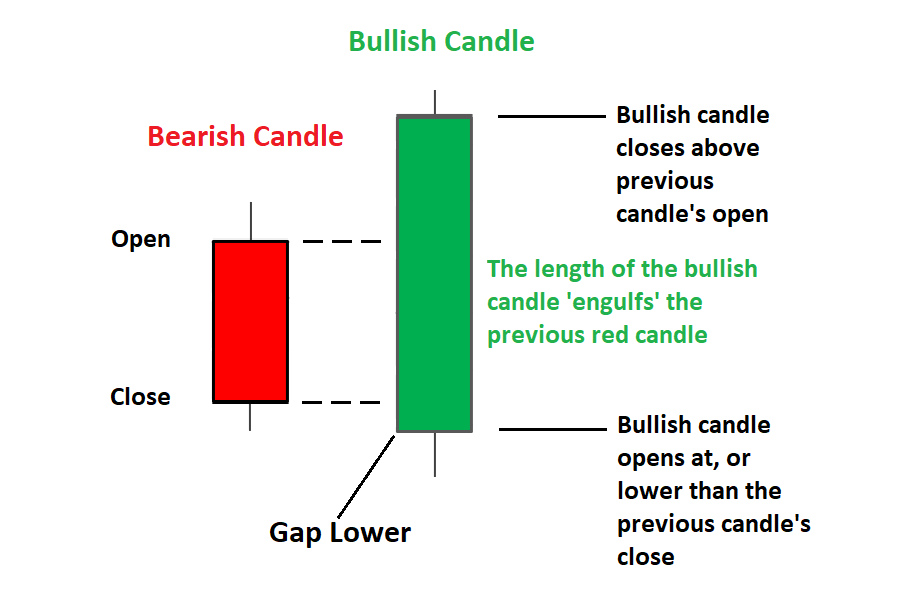
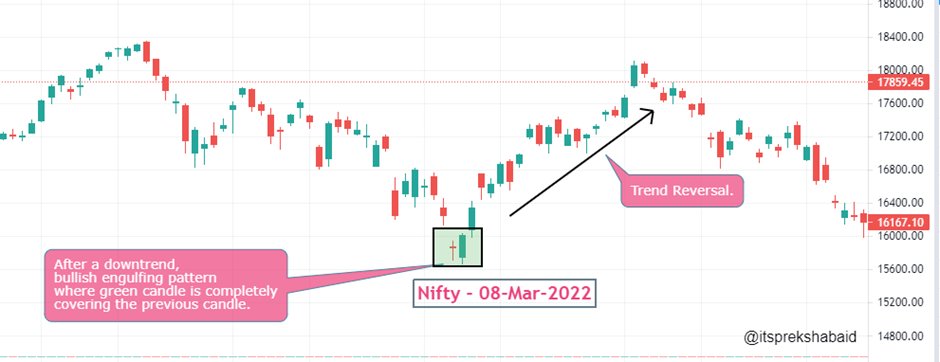
A bullish engulfing pattern appears when a large green candle appears after a small red candle of the previous day. The body (Green candlestick) of which completely cover the body of the previous day’s (Red) candlestick. (2/10)
This pattern signifies a change or a reversal in the ongoing trend of the prices of a particular security. (3/10)
Generally, the bullish engulfing candle is preceded by more red candles, representing a bearish phase in the market. In fact, the bullish engulfing candle usually represents the bottom of a downward trend in prices, after which the prices begin to show an uptrend. (4/10)
This bullish reversal pattern is found at the end of a downtrend.
When visible, this bullish pattern signals that the previous downtrend has ended and a potential reversal trend (a new uptrend) is beginning. (5/10)
When visible, this bullish pattern signals that the previous downtrend has ended and a potential reversal trend (a new uptrend) is beginning. (5/10)
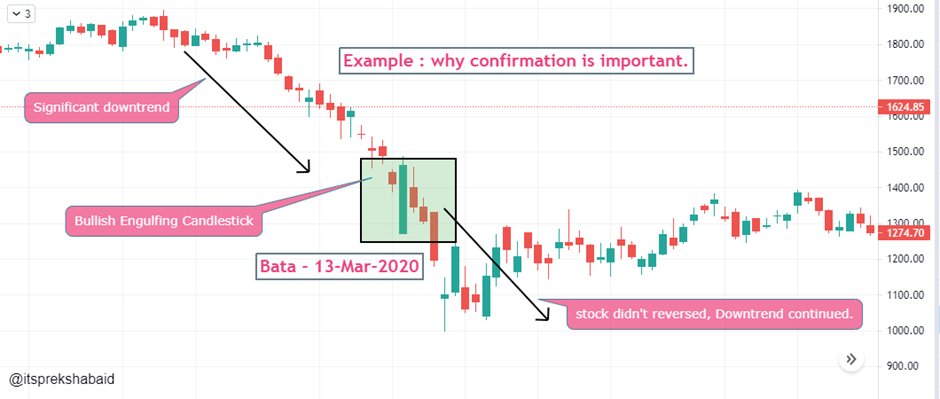
This pattern is very easy to find out, but confirmation is very important before any entry.
Don’t do a silly mistake like-
“Look. It’s a Bullish Engulfing Pattern. This is a sign of strength, let’s buy!”
Next thing you know, the market reverses and your stoploss gets hit.(6/10)
Don’t do a silly mistake like-
“Look. It’s a Bullish Engulfing Pattern. This is a sign of strength, let’s buy!”
Next thing you know, the market reverses and your stoploss gets hit.(6/10)
Taking Confirmation-
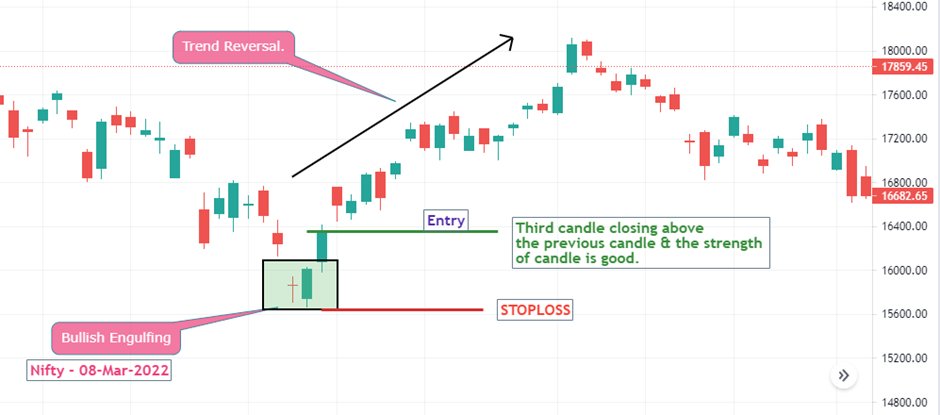
When you see bullish engulfing pattern in any stock, keep an eye o the next candle (Third candle)
✔Check the strength of third candle.
✔It should close above the 2nd green candle & if the volume also turns high that it can be bonus for you. (7/10)
When you see bullish engulfing pattern in any stock, keep an eye o the next candle (Third candle)
✔Check the strength of third candle.
✔It should close above the 2nd green candle & if the volume also turns high that it can be bonus for you. (7/10)
In our example,
Third candle gives the confirmation to bullish engulfing pattern.
✔We can now take entry above the confirmation candle to ride the reversal.
✔Stoploss should be below the low of engulfing pattern. (8/10)
Third candle gives the confirmation to bullish engulfing pattern.
✔We can now take entry above the confirmation candle to ride the reversal.
✔Stoploss should be below the low of engulfing pattern. (8/10)
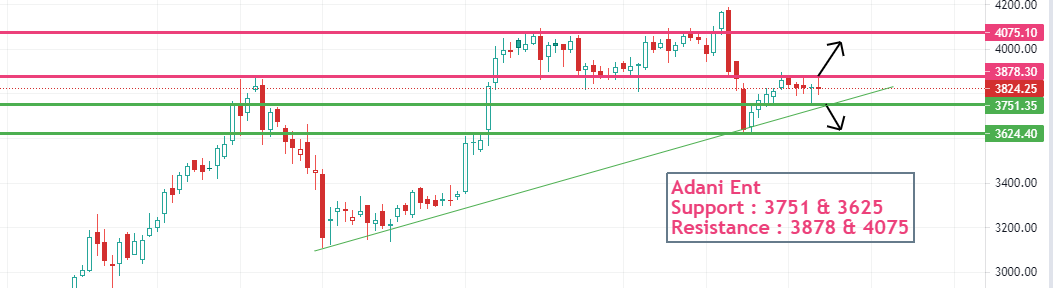
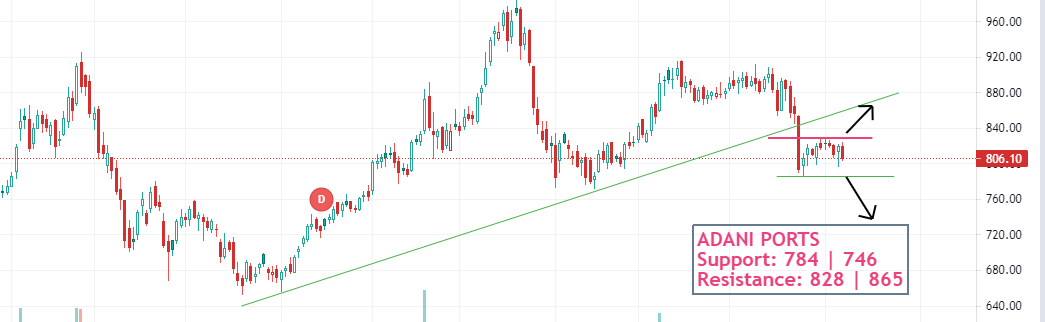
Target/Exit Point:
✔I always follow next resistance level as my target.
Always mark strong resistance areas in your chart and use them as a target for a perfect exit. (9/10)
✔I always follow next resistance level as my target.
Always mark strong resistance areas in your chart and use them as a target for a perfect exit. (9/10)
♥If you found this thread useful, please RT the first tweet.🔁 (10/10)
• • •
Missing some Tweet in this thread? You can try to
force a refresh