QF Research Profile picture
Jan 13, 2023 4 tweets 3 min read Read on X
1) I respect @garyblack. He deals with facts tho may disagree with analysis.

Here's $TSLA '23 sales and OP est in same format (no updates for US/EU price cuts yet).

'23 cons rev $109B (+33% Y/Y). Cons OP $19B or 17% OM.

~ 10-20% price cuts ...

$SPY $QQQ $TLT $GLD #Commodities ImageImage
2) flows directly to bottom line (assuming all else equal for now e.g. opex unchanged).

It's tough for OM not to decline 50% or more even if units grow > 50% (and I'm doubtful).

I.e. EPS could easily fall 50%.

After every price cut there's a quick orders spike. Unknowns ...
3) dominate after that.

Reminder orders had to double (or more) 1H '23 just to make estimates given depleted backlog (meant Q4 orders were as low as ~200-250K).

Now even if order run rate double (we'll see) profitability falls something in order of ~50%.
4) Gary must realize this isn't correct way to view '23 consensus since most estimates are stale.

Avg $TSLA '23 EPS post 1/13 is $3.88.

Avg '23 GM is 22.1% (too high IMO).

Big dispersion. Will change with more updates.

$SPY $QQQ $TLT $GLD #Commodities

• • •

Missing some Tweet in this thread? You can try to force a refresh
 

Keep Current with QF Research

QF Research Profile picture

Stay in touch and get notified when new unrolls are available from this author!

Read all threads

This Thread may be Removed Anytime!

PDF

Twitter may remove this content at anytime! Save it as PDF for later use!

Try unrolling a thread yourself!

how to unroll video
  1. Follow @ThreadReaderApp to mention us!

  2. From a Twitter thread mention us with a keyword "unroll"
@threadreaderapp unroll

Practice here first or read more on our help page!

More from @ResearchQf

Oct 20
1) Mainstream DRAM and NAND spot prices were up 10% last night alone. DDR5 spot just doubled. I've never seen this before.

$MU and SK Hynix almost doubled since local bearish peak for DRAM & HBM in Aug. Large parts of buy & sell-side as well as Fintwit.

Do math for "commodity" DRAM margins. Assume spot goes sideways and contract (which lags spot) ~ catches up. If 100 price/50 cost = 50% GM. 200 price/50 cost = 75% GM (!).

It's not surprising every time I turn around, any incremental price negotiations for HBM3e and HBM4 sound better. Have discussed varying fungibility timeframes between DDR and HBM as well as flash.

Peak EPS power looks a little nutty. Again, normalized earnings matter as much. I.e. when there is a future downturn, will trough EPS also be higher?Image
2) Then consider that this is happening in what just could be the very beginning of several AI drivers that are very storage & memory intensive.

Maybe not. But could this cycle also be unlike pre-AI cycles that investors reflexively pattern match to?
3) $SNDK up 2.8x & Kioxia up 2.7x since this post. I'd mentioned that if one had payed close attention, sharp improvement in NAND was clear earlier.

3 of top 4 stocks YTD in S&P 500 is storage or memory. If SNDK had spun off earlier, would be 4 of top 5.
Read 4 tweets
Sep 18
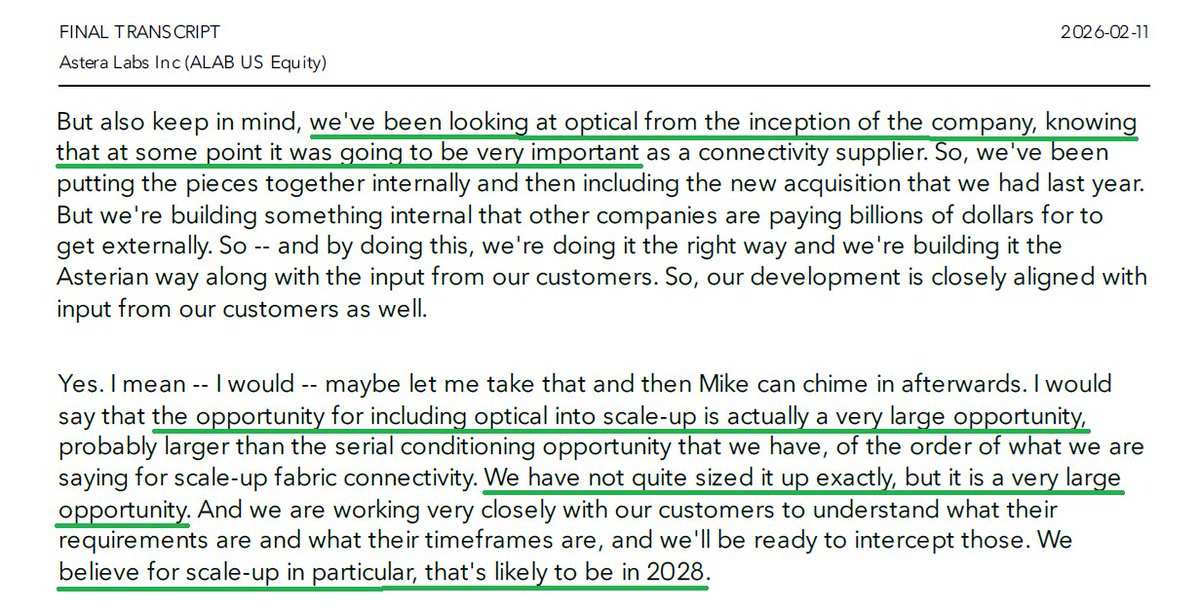
1) $COHR risk/reward improved IT, and I rotated a part of LITE back into COHR. It's still a smaller position.

$LITE almost tripled past year and outperformed COHR 2.2x. For good reasons. LITE was, and still is, better positioned across a range of current and future interconnect technologies & products.

As a result, LITE's forward earnings cons rose > 30%. COHR's forward cons was almost flat after last 2 Q's.

But based on data today, COHR numbers also have greater upside vs downside while valuation compressed. LITE also became much too big in the portfolio, but that's portfolio dependent.Image
2) A number of interconnect stocks have been explosive. So have stocks in other sectors discussed since spring. Cool to hotter storage, tier 2 & 3 infra & power capacity, physical AI, rare earths etc.

Not that classic AI infra leaders haven't done well. And my confidence has grown recently that chance of bigger $NVDA upside(s) by Jan Q is higher than normal, even as the stock lagged some recently.

A common denominator is high leverage (in a good way) to AI growth. It's interesting that the range of sectors and stocks that are, or will soon be, levered AI beneficiaries, or losers, is growing rapidly.

Not a surprise. AI is touching everything we do and has started to transform entire industries.Image
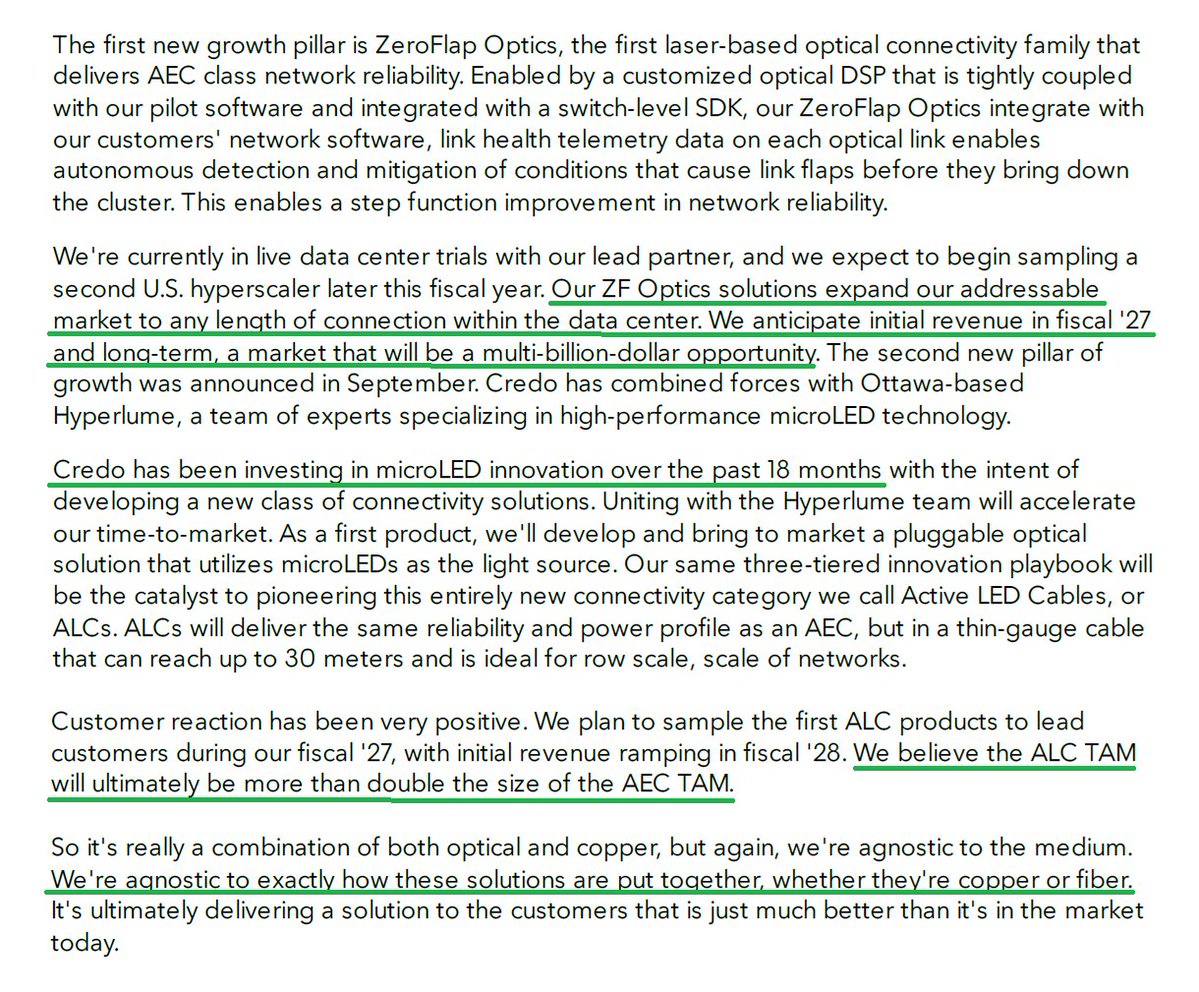
3) Back to COHR and LITE (which remains a top interconnect position). In May, I mentioned LITE CQ4 2026 could be well into $600M's, which was well above cons. That cons is now $678M, and a > $700M Q is a now decently more likely than not.

A very interesting narrative is wrt certain new techs being, or will soon be, real drivers of growth. These are "high multiple technologies that should drive investor imagination." Even some products that seemed less interesting, such as VCSEL MMF interconnects, are promising again. Short distance scale-up, which has become a high multiple set of words.

Another reason to mention LITE is that it has real apple to apple compares from late 90's to early '00. Hence the wording of high multiple technologies. On a valuation basis, it's nowhere near that bubble.

Price is also far more extended from long term averages than anytime in history since its spinoff from $VIAV in 2015, yet price extension is also nowhere near similar companies during the dotcom boom.

Nothing is guaranteed, but if markets enter what I've referred to as pre-bubble stages, will discuss those compares in detail then. None of those patterns have to repeat, including typical post-bubble busts, even if bubble-like behavior occurs. AI is fundamentally different. But there might still be some lessons.Image
Read 4 tweets
Sep 14
1) Remember that Feb mini-panic about data center oversupply? Here's a DC & DC supplier update. 10Q's are also must reads. And perhaps Larry does believe what he said last week. $ORCL is making commitments.

Here's one of the Cowen notes that triggered that scare. $MSFT cancelling leases "points to a potential oversupply position." AI trade was all over, again.

Mentioned at the time "what DC industry is seeing globally is the opposite." Cowen had taken -1 + 2 = +1, but only pointed out -1. And this was before the huge surge in inference, which is continuing.

What were MSFT & ORCL lease commitments in Q1?

MSFT. Commitments dropped from $117B (CQ2 2024 peak) to $99.2B (CQ1 2025).

ORCL. Commitments rose from $22.9B to $48.4B in same period (Feb Q ≈ CQ1). ORCL's gains alone more than offset MSFT, even though it was a smaller player.

And MSFT stated "the next spend will begin to shift back to short-lived assets, which are more correlated to revenue growth" on its earnings call Jan 29th.

At most, MSFT lease commitments might've overshot some (lease commitments had risen $74.9B in just one year to CQ2 2024 peak, or from $42.1B CQ2 2023 to $117B CQ2 2024!) while they shifted focus to filling data centers with AI infrastructure.

And finally, MSFT and ORCL, and most other CSPs, guided to significantly higher capex in latest calls.Image
2) What are the most recent numbers? ORCL's lease commitments shot up by $56.4B Q/Q or more than doubling Q/Q! This doesn't include $6.6B in further commitments 10 days into Nov Q.

Looking at ORCL & MSFT alone, data center lease commitments are up $55.8B, or by +41%, YTD.

I'd also take 50:50 odds that MSFT DC commitments starting to rise again Sep Q.Image
3) So does Larry believe what he said, even if some don't? He's committing real $'s.

One might also argue aggregate future token demand won't depend on whether @OpenAI $GOOGL or someone else is the market leader. Or could there be true AI disaggregation?
Read 4 tweets
Sep 3
1) $NVDA is more likely have bigger upside(s) than usual by Jan Q.

Based on a pretty broad set of data points. It's also not impossible that Oct Q could also be quite decent. Given NVL run rate by Q4, one week in timing could mean over +/- $3B.

But timing won't matter if NVDA DC rev has larger than usual midpoint for combined Oct + Jan Q vs $101B DC cons for that period.

This is independent bottoms up & top down build. I.e. most sell side models look more conservative than typical. There's always a spread, could be wrong, but my midpoint is higher than normal vs expectations. Subject to quick change with.

More importantly, 2026 outlook and even beyond is still improving due to variety of demand drivers. AI top down is accelerating is still crazy.Image
2) One recent data point.

Few believe/model HH +300% Q/Q. HH reiterated +300% during JPM Asia tech tour days ago with 1M left in Q3. Upside risk vs models?

"Temporary" small ODM issues were Quanta & Wistron. Order strength. Keep in mind other suppliers.
3) No idea if NVDA bottoms this week, month etc but doubt this is over by a long shot.

This is indep of whether Sep is a skewed coin (or not). If Sep is good, was it heads on 40% coin? If bad, was it tails on 64% coin?

How much more mom value reversion?
Read 5 tweets
Aug 12
1) $NBIS and $APLD now outperformed > 2x despite $CRWV bouncing. AI inference spikes overflowed to CRWV and then even 3rd tier such as APLD. NBIS is another +40% since 7/18.

NBIS raised year end ARR from $700M-$1B to $900M-$1.1B. Despite higher ARR and sales more than doubling Q/Q, NBIS didn't raise rev guide due to expected delivery of GPUs coming online by the end of the year, "particularly the Blackwell Ultras."

"Pricing is stable for Hoppers" and "we did bring on the B200s, and we are actively selling through them well."Image
2) Less overhang and "cheaper," yet still not profitable. But listen to the call and do a moderate bull case back of envelope. And consider secular environment

NBIS capacity target is 220 MW this year, with > 1 GW contracted capacity end of 2026. E.g. there is 200 MW under construction in NJ, part of which will come online this year.

Like APLD, it's a seller's market for anyone with future capacity.Image
3) NBIS & APLD are at 3+ year highs. Not sure 2021 is a real compare (yet). There was an actual, but fairly narrow & short-lived bubble in 2021, when price action was much crazier than today and sometimes approached final year or two of the dotcom bubble.
Read 4 tweets
Aug 8
1) Nice week for AI but software net exposure was at 5 year lows, and negative, near July end (GS PB).

Glad didn't post this then. We all wanna be contrarian.

Semi exposure was also at lows entering 2023. Remember tech (and general equity) sentiment then?

But that was right after ChatGPT moment, though market took a while recognizing its importance. Imo we're still in very early innings of understanding consequences of AI. Many are still trying to ignore it.Image
2) Semis to ratio is now at 21Y high?

Pretty chart. Is it breaking out again after consolidating?

This is only 20% serious. I've chart-mined, tho GICS do have long history. Semis include many non-AI semis. Many are down or barely up since GPT. Software has a big AI infra ... Image
3) components $MSFT $ORCL $SNPS $CDNS.

So this S&P GICs ratio *understates* AI semis vs non-AI infra software, which act like old media stocks when internet & streaming began kicking in.

Could SaaS have huge rallies given nets? Sure. Would I try to ...
Read 6 tweets

Did Thread Reader help you today?

Support us! We are indie developers!


This site is made by just two indie developers on a laptop doing marketing, support and development! Read more about the story.

Become a Premium Member ($3/month or $30/year) and get exclusive features!

Become Premium

Don't want to be a Premium member but still want to support us?

Make a small donation by buying us coffee ($5) or help with server cost ($10)

Donate via Paypal

Or Donate anonymously using crypto!

Ethereum

0xfe58350B80634f60Fa6Dc149a72b4DFbc17D341E copy

Bitcoin

3ATGMxNzCUFzxpMCHL5sWSt4DVtS8UqXpi copy

Thank you for your support!

Follow Us!

:(