
PM at large institutions. Investment decisions are your responsibility. DYODD. Analyze distributionally but non-deterministically. RTs aren’t endorsements.
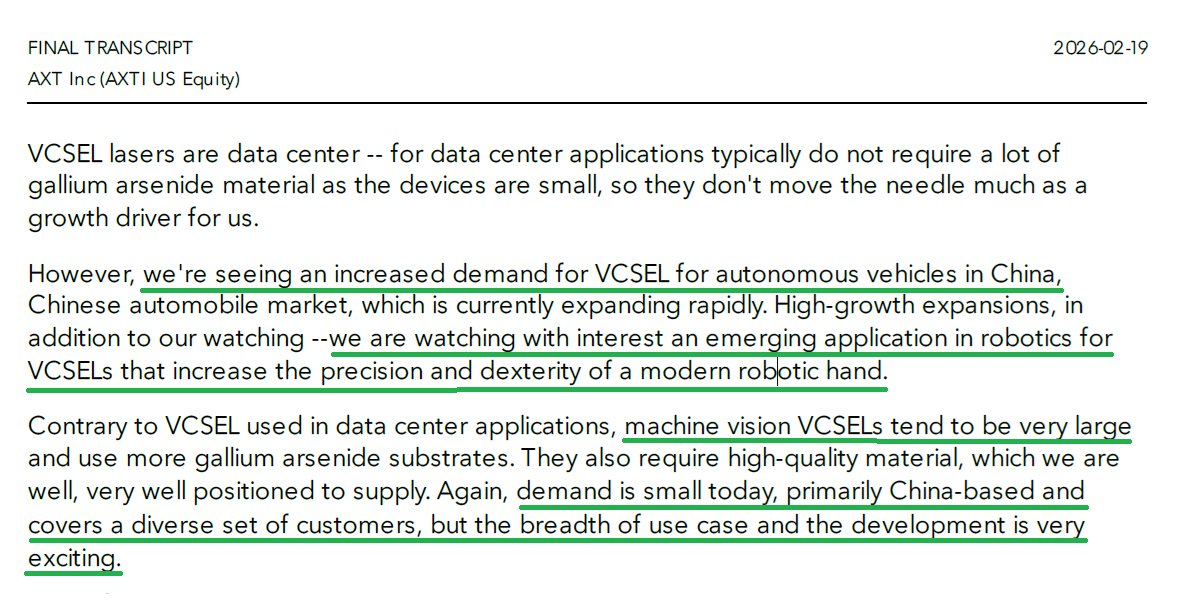 2) GaAs substrates historically dominated AXTI shipments. InP inflected in 2025 due to AI datacom.
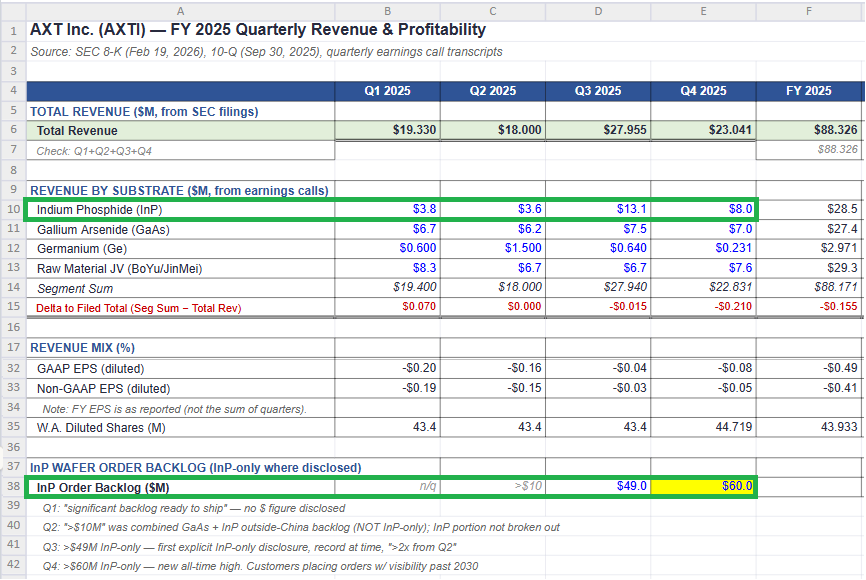
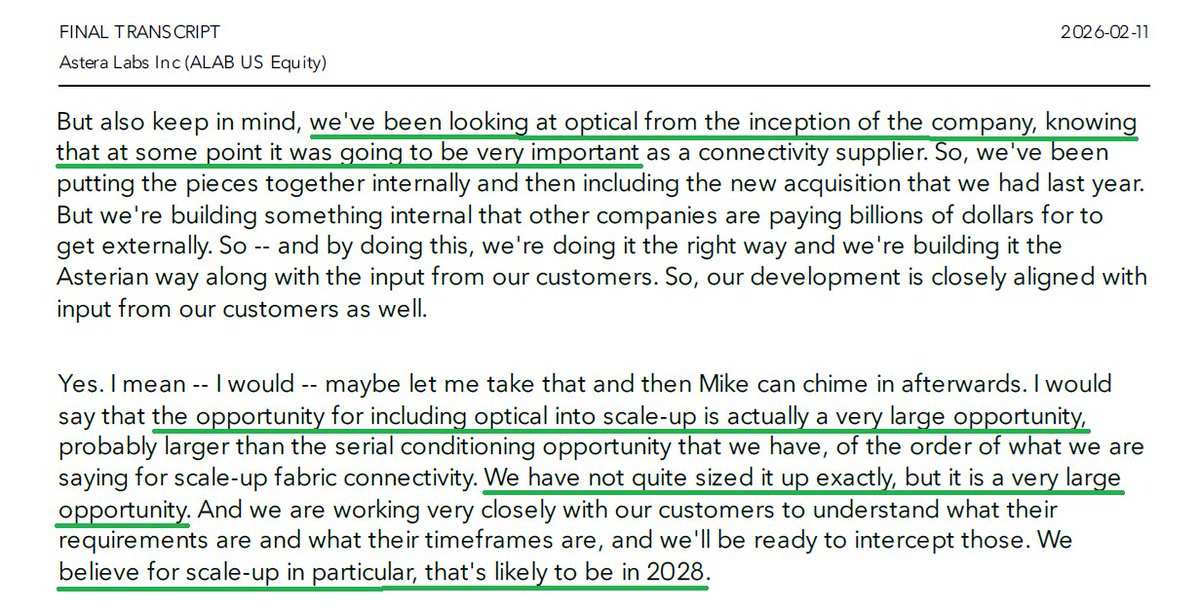 2) $CRDO optical road map based on Dec earnings call and Jan conference comments. ZeroFlap Optics and Active (micro)LED Cables or ALCs.
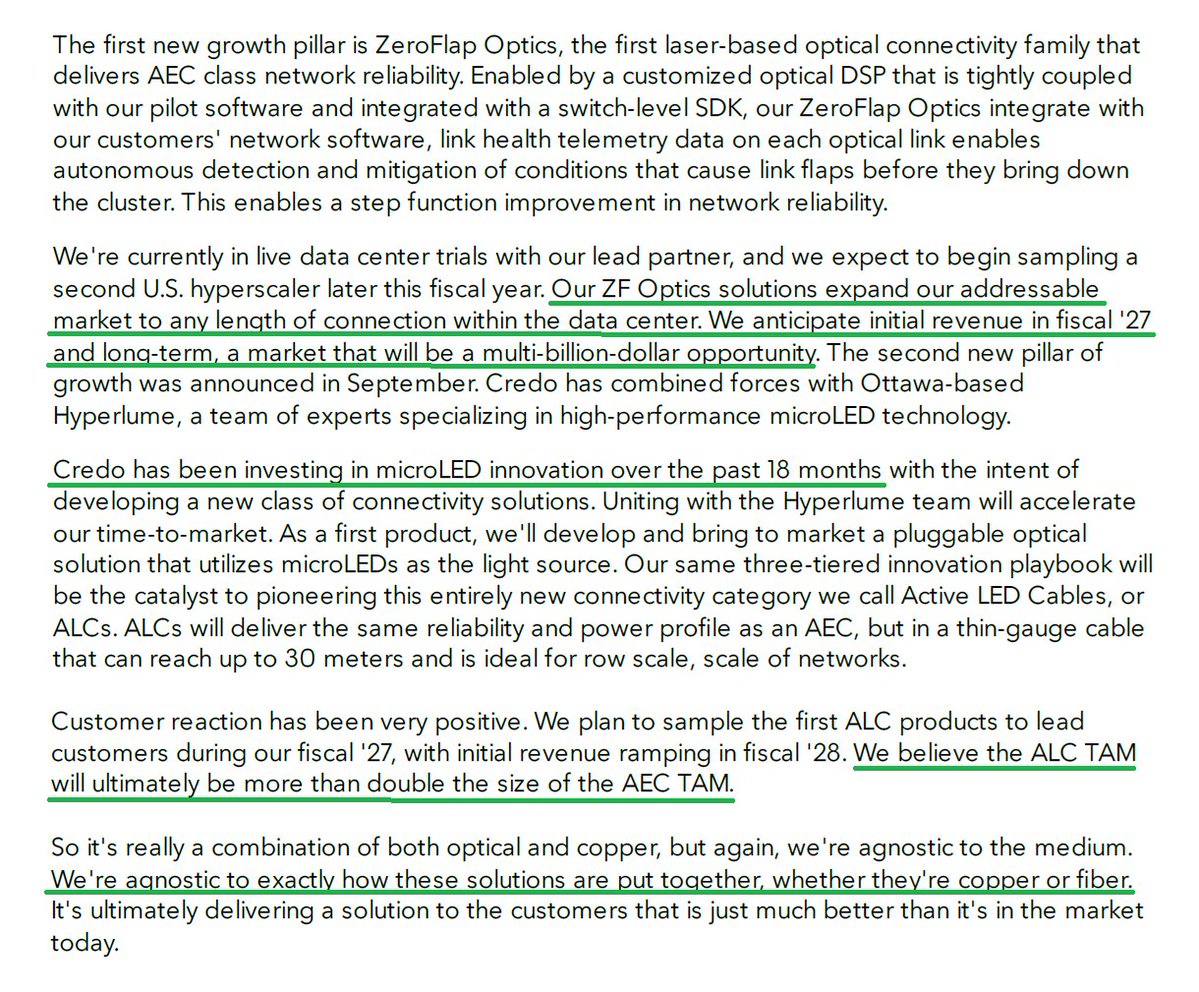
 2) Then consider that this is happening in what just could be the very beginning of several AI drivers that are very storage & memory intensive.
 2) A number of interconnect stocks have been explosive. So have stocks in other sectors discussed since spring. Cool to hotter storage, tier 2 & 3 infra & power capacity, physical AI, rare earths etc.
 2) What are the most recent numbers? ORCL's lease commitments shot up by $56.4B Q/Q or more than doubling Q/Q! This doesn't include $6.6B in further commitments 10 days into Nov Q.
 2) One recent data point.
 2) Less overhang and "cheaper," yet still not profitable. But listen to the call and do a moderate bull case back of envelope. And consider secular environment
 2) Semis to ratio is now at 21Y high?
 2) MP beat but current numbers don't mean much.
 2) Jensen's high level TAM comments at yesterday's annual meeting was nice but they're hard to distinguish from previous comments. What are durations of these TAMs and shape of deployments?
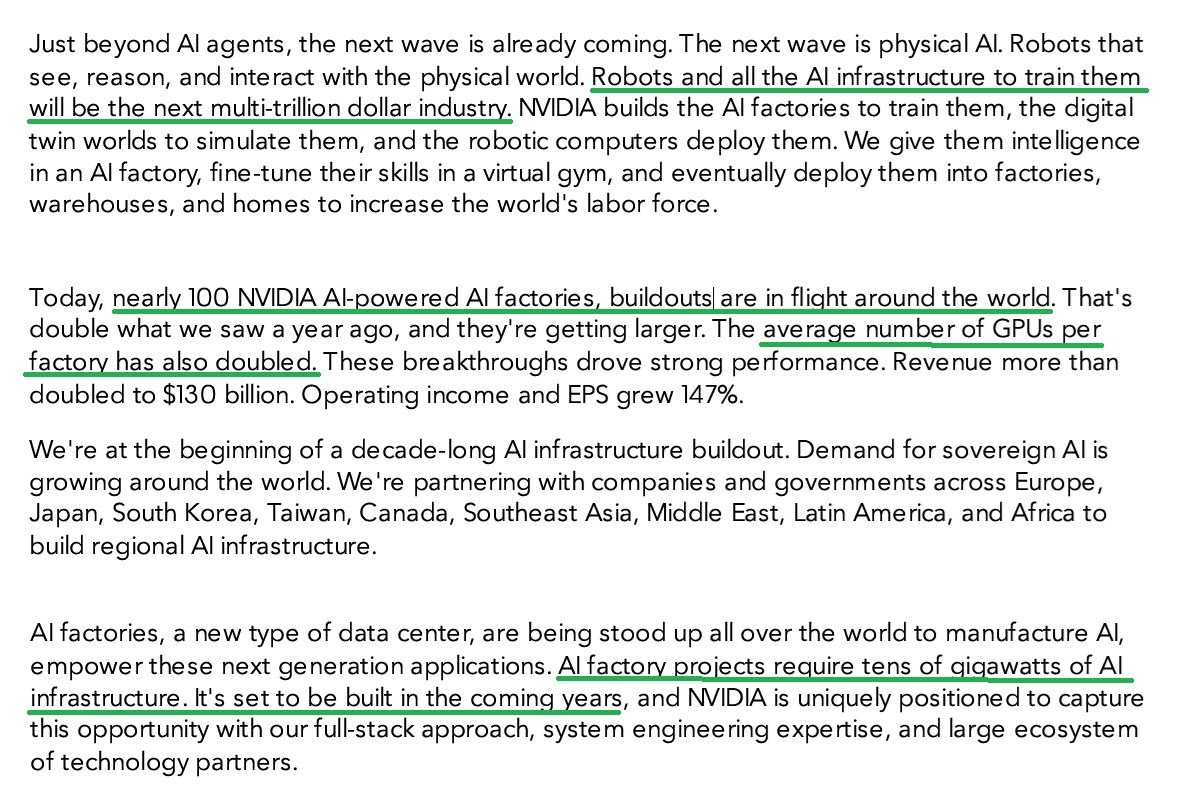

 2) Rare earths are necessary for huge ranges of industrial, tech, automotive, robotic, defense (e.g. drones, missiles, fighters) and consumer products.
 2) So stocks are saying "this isn't a real cycle." DDR4 will be legacy soon but still.
 2) Next elements of Cowen note. International first.
 2) generally ignored.


 2) to frame an objective reality with his EPR paper (QM is correct but are there hidden variables?).

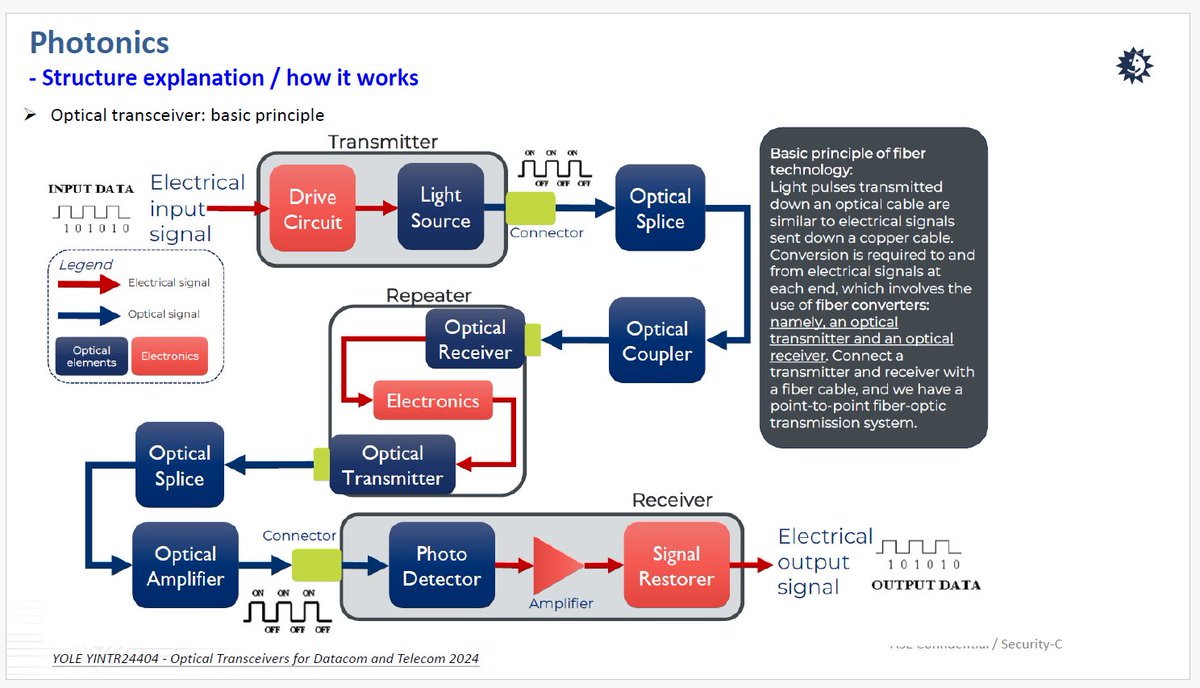
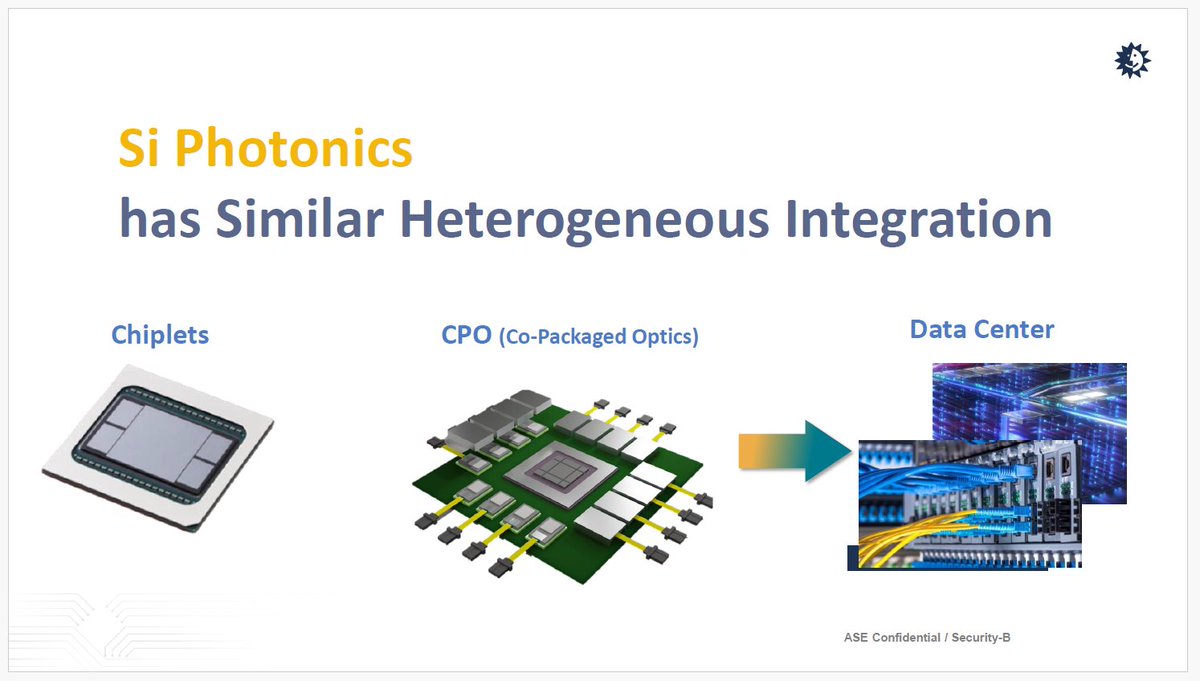 2) ASE is a key OSAT (outsourced semi assembly and test) and does almost anything backend.
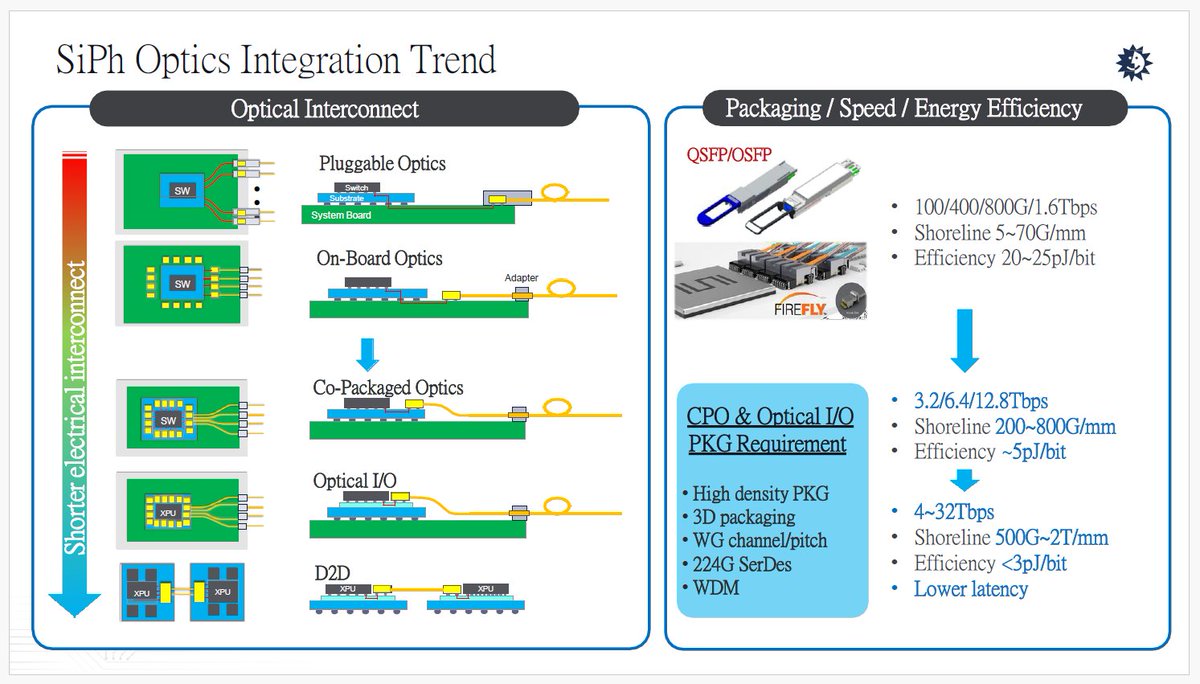
 2) Ph.D. STEM problems, agents etc skills are better known and amazing, but here is just one example that combines reasoning, expertise, application (interconnects will be huge + also dear in my portfolio) in a way I haven't seen.
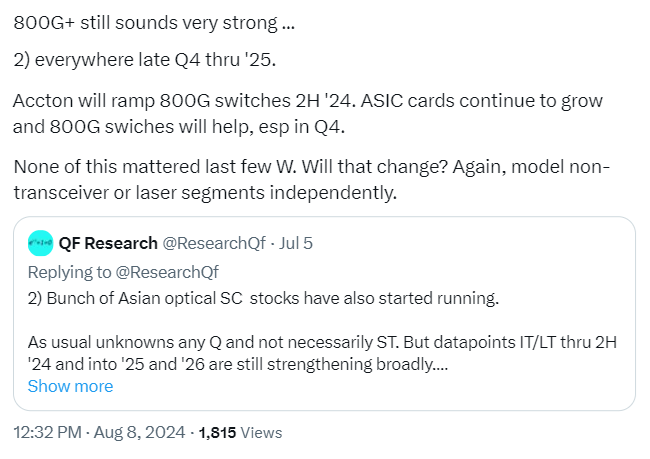 2) multiple other poss customers. LITE said last Q that even 1 new customer could double datacom rev.
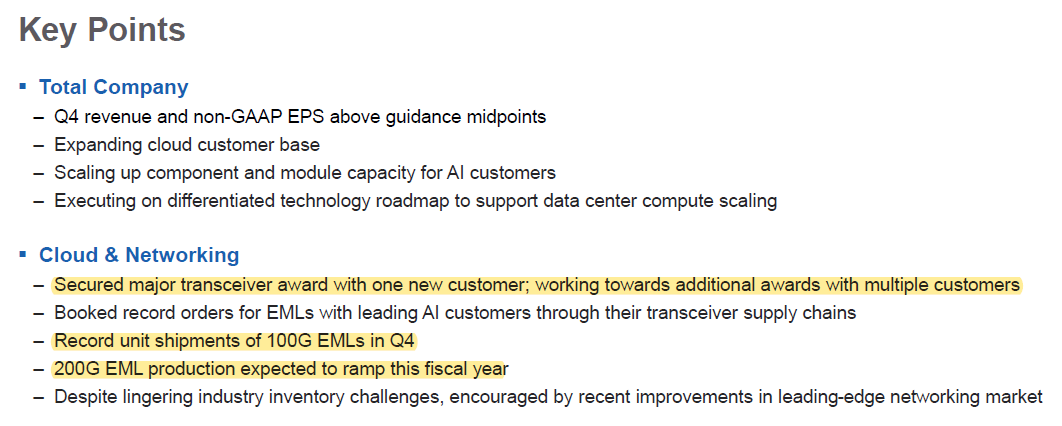
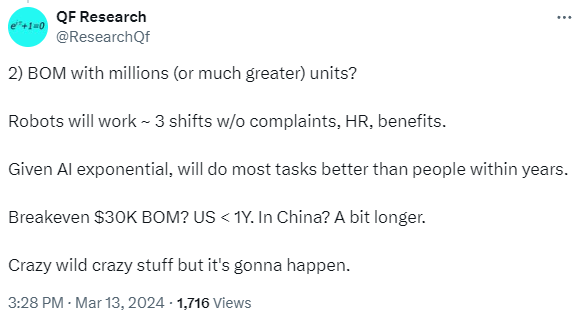
 2) Now the interesting part. There's a chance MP is a robotic+ beneficiary.