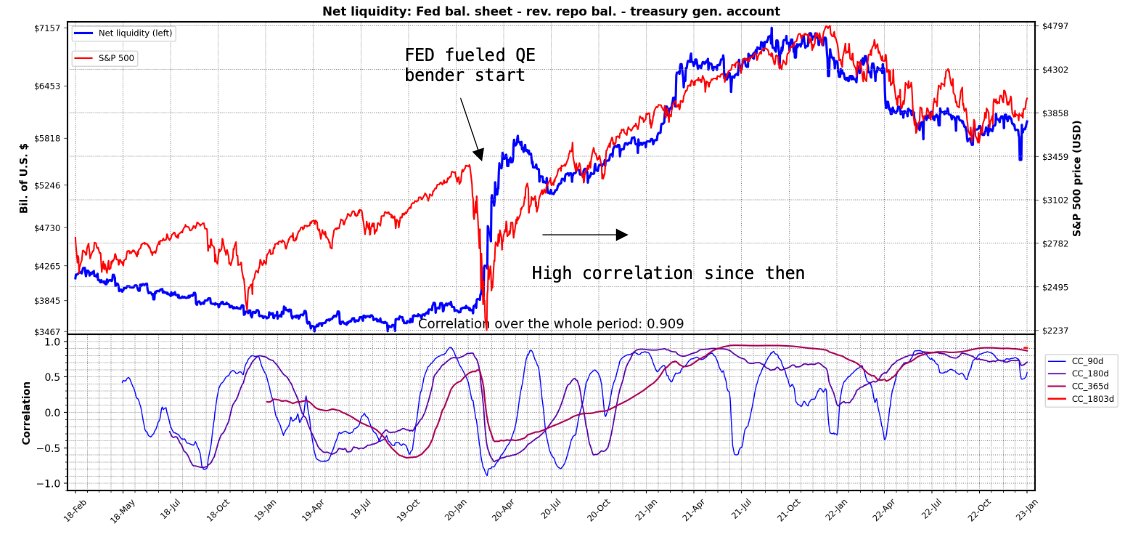
USD NET LIQUIDITY (NLQ) -important macro metric to track. Originally formulated by @42Macro, NLQ provides estimate of total liquidity to markets from Fed, treasury & bigFunds. Markets show high correlation with NLQ. Use my #python script to track this yourself w/daily update.🧵 

2/ Following March 2020, the huge surge in net liquidity caused by unprecedented QE made this liquidity tide the primary driving force in markets. High correlation now seen between SPX, NDQ, DJI, BTC etc & NLQ. Great intro here by @maxjanderson:
https://twitter.com/maxjanderson/status/1546472693234470912?s=20&t=vBf3LXuHw-U4X9s0fn5ZiA
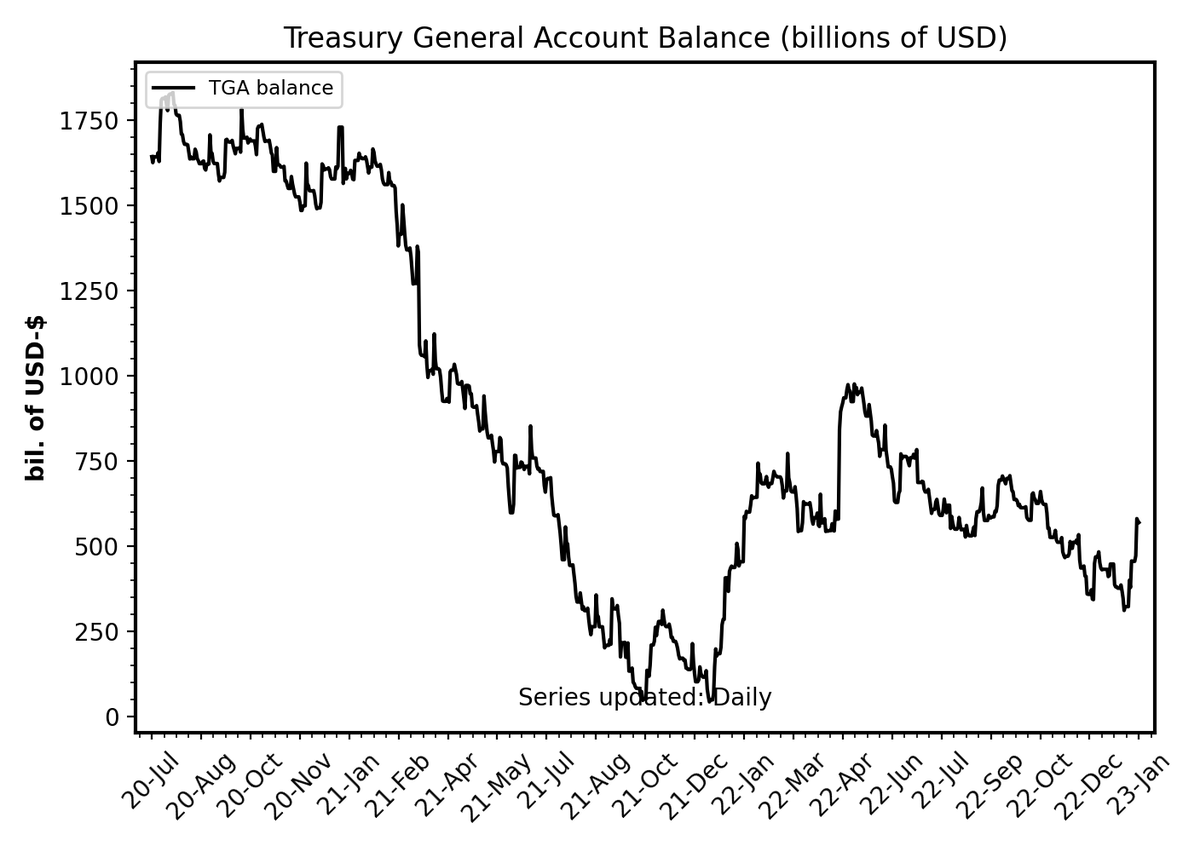
3/ Max’s thread provides great explanation of importance of NLQ & where to get the data. You’ll need code though to display it. I’ve done this for you (in #python). It uses Fed bal. sheet (weekly) & RevRepo (daily) from FRED. It gets the TGA bal. daily series from treasury API.

4/ You’ll need an account and API key from FRED to use script. Totally free: fred.stlouisfed.org
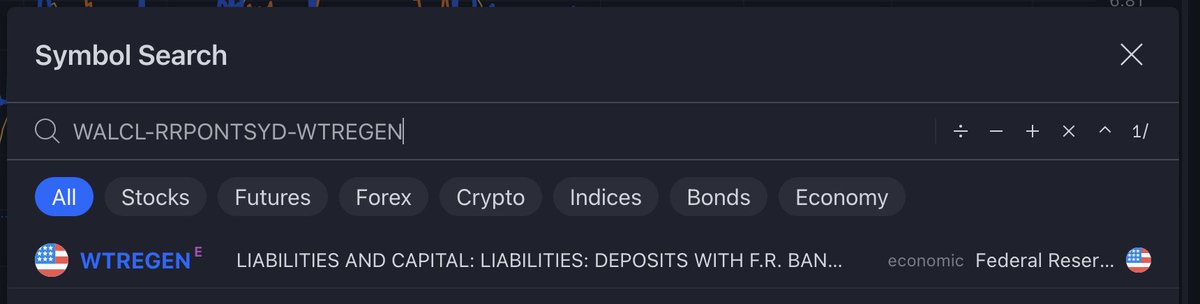
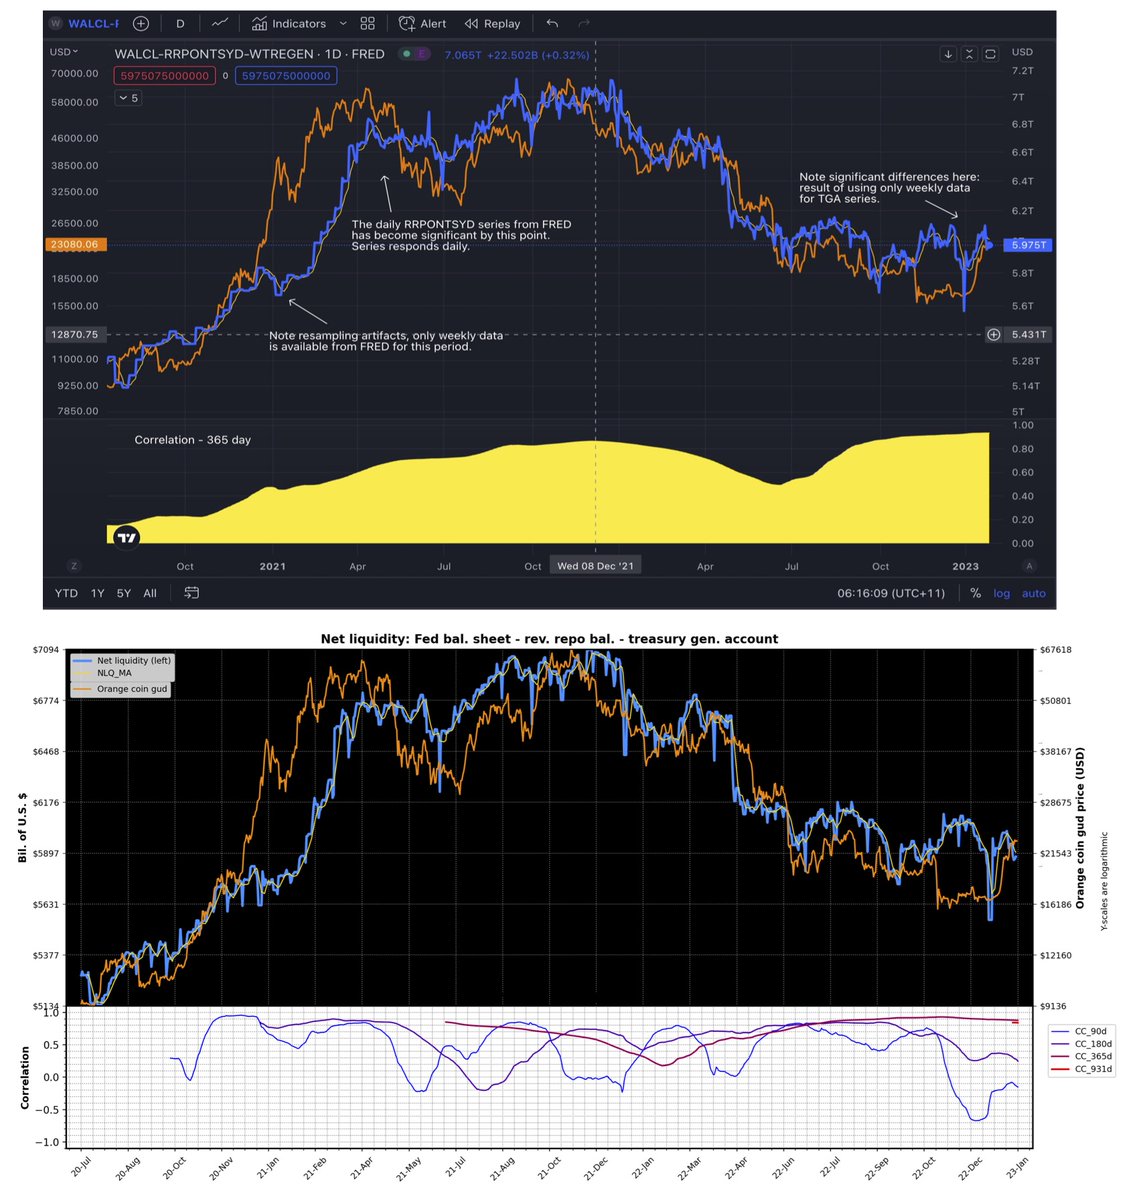
You can also see NLQ on tradingview, search: WALCL-RRPONTSYD-WTREGEN
You can also see NLQ on tradingview, search: WALCL-RRPONTSYD-WTREGEN
5/ TV gets the 3 series from FRED. Fed bal. sheet (WALCL) is updated weekly, TGA (WTREGEN) & RevRepo (RRPONTSYD) bal. are updated daily. From FRED, you get only weekly average of TGA. Thus NLQ series on TV is mostly weekly data and doesn’t move much on the daily.
6/ My script output compared to trading view. Hard to beat a TV chart but I think mine comes close. There may be some advantage using my script as it utilizes daily TGA data. Note differences in the NLQ traces (blue) here, especially recently.
7/ You can choose up to 5 assets for comparison. Correlation is calculated for the first asset (BTC in this case below). Prices sourced from yahoo, google finance, trading view, coin gecko and others, this covers the majority of world ticker assets.
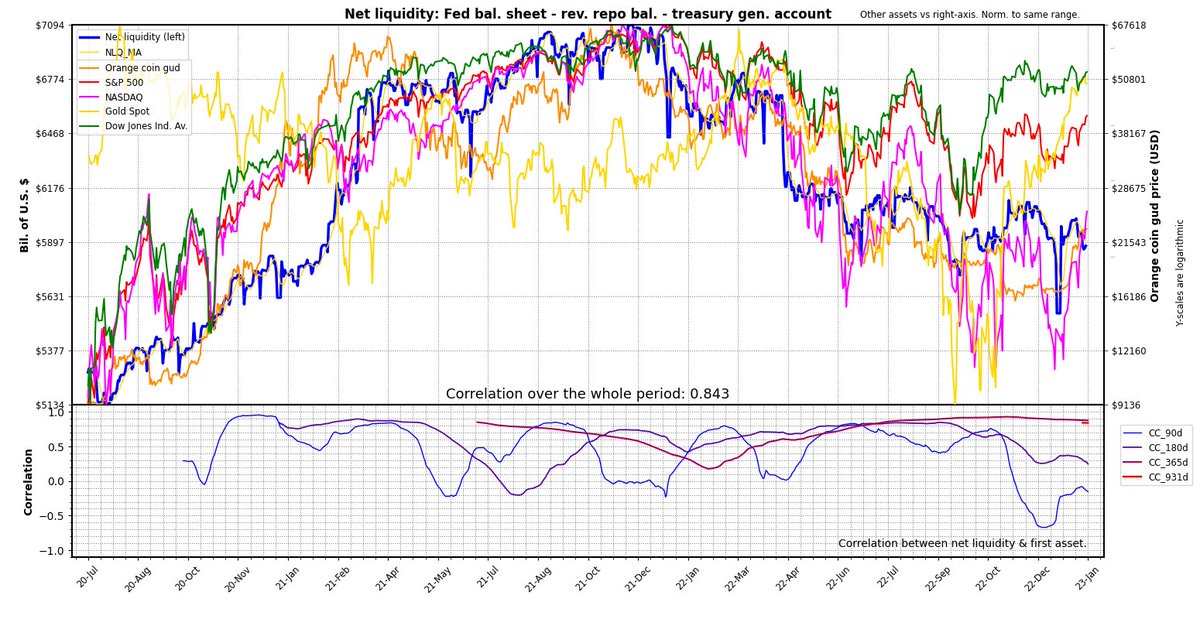
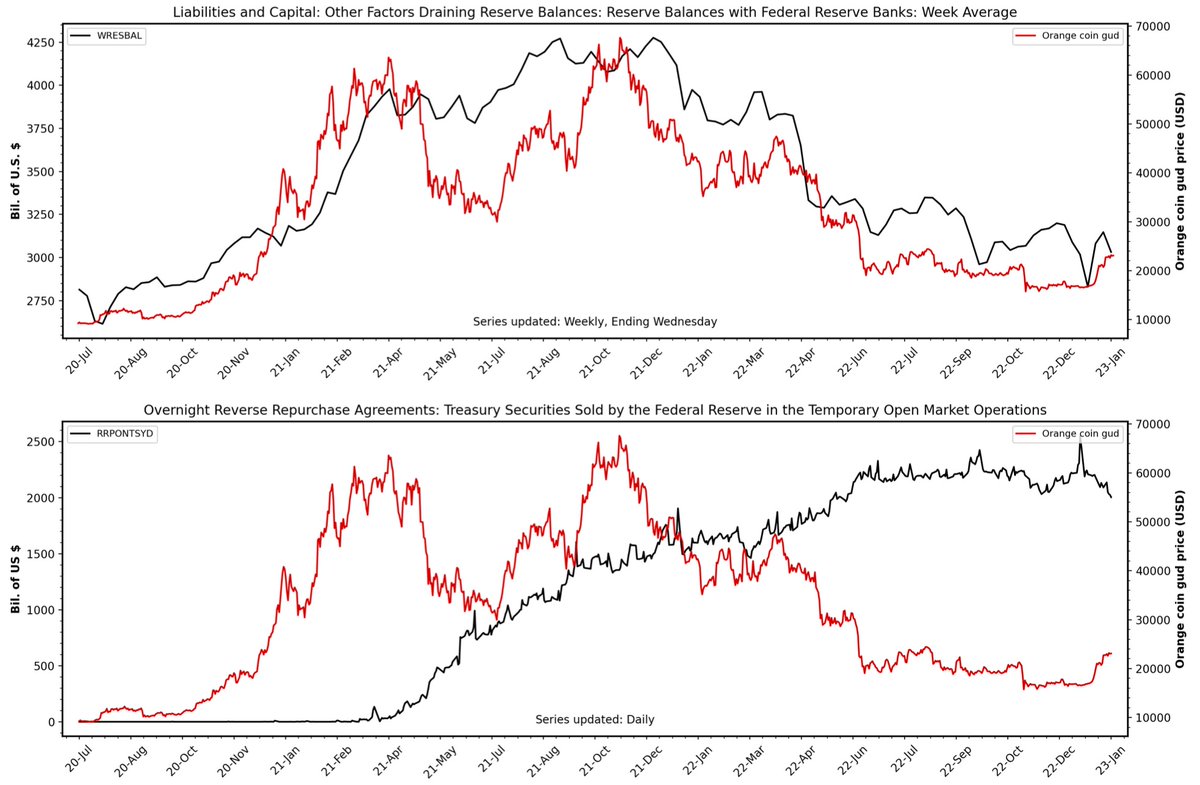
8/ You can also view any of the FRED series with a comparison asset in charts like these.
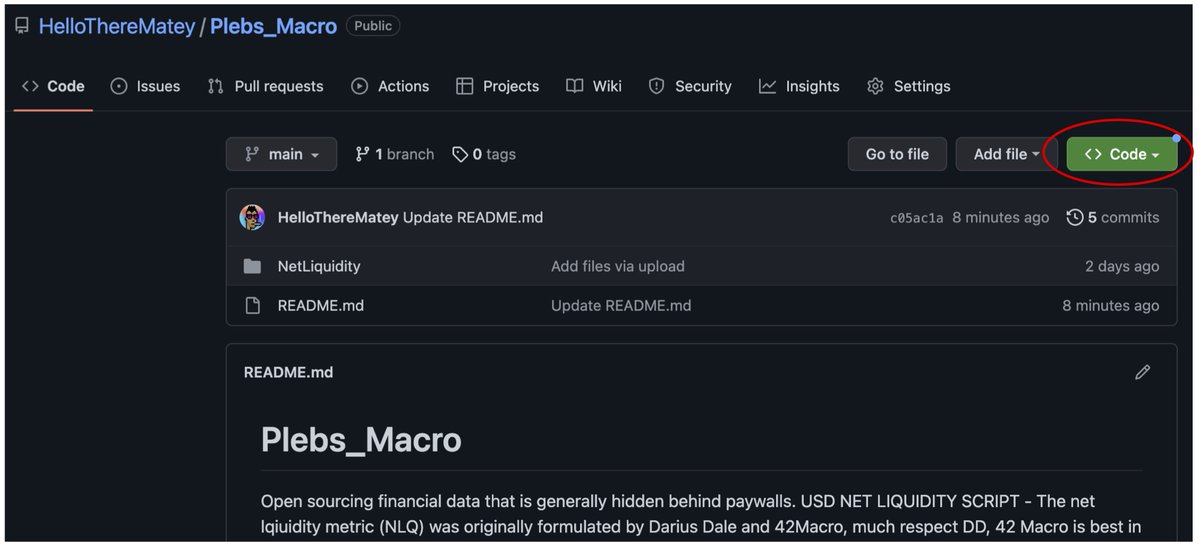
9/ Script is easy to use even if you’ve never coded. I’ll show how to use through terminal & excel on windows,mac,linux. 1. Go to the github repo and download the repo folder (Code -> Download ZIP):
github.com/HelloThereMate…
github.com/HelloThereMate…
10/ Unzip & place NetLiquidity project folder where you wish. Open terminal, Enter: python –-version to check if python installed. Also check for pip. On mac use python3/pip3.
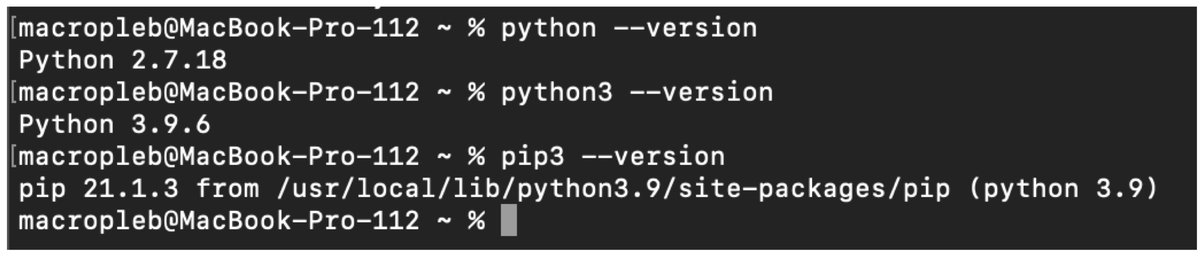
11/ If you’ve no python/pip installed you’ll see ‘command not found’. On windows, search ‘python’ on windows app store and install latest version free. Mac/linux see:
docs.python-guide.org/starting/insta…
docs.python-guide.org/starting/insta…
12/ Now you have python & pip, you’ll need the required modules used by the script. Type ‘cd’ and drag & drop the ‘NetLiquidity’ folder onto the terminal + hit enter. That will set it as the working directory.

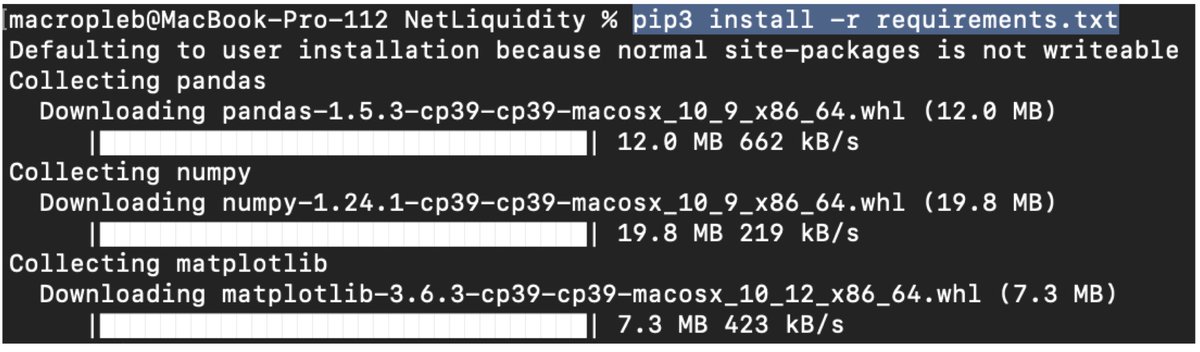
13/ Use pip to install the required python modules, enter: 'pip install –r requirements.txt' (pip3 on mac). These are collections of python scripts like mine yet are better written and are well-vetted by community.
14/ Now you’re ready to use the script. Open 'NetLiquidity_InputParams.xlsx'. All parameters are set using this file. Simply enter ticker names, start date etc in the cells indicated in “Parameters’ sheet, save file. Helpful info & parameter descriptions is found in other sheet.
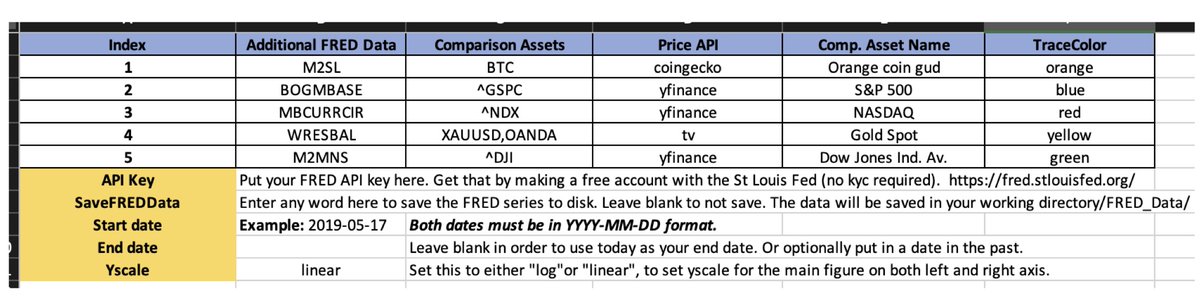
15/ .csv or .ods etc. could be used as free alternatives to excel, let me know if you want support for that. You can choose up to 5 assets to plot atop NLQ & 5 extra series to pull from FRED.
16/ Now run the script. Enter 'python ShowNetLiq.py' in terminal to run the script (python3-mac). Must have the NetLiquidity directory set. Here’s a video of the process below. Internet access necessary to run script.
17/ Let’s compare the data with other sources for verification. TV comparison on tweet 6. Below at top is @42Macro chart from Jan 3 and my chart at bottom. The NLQ series (blue) are almost identical.
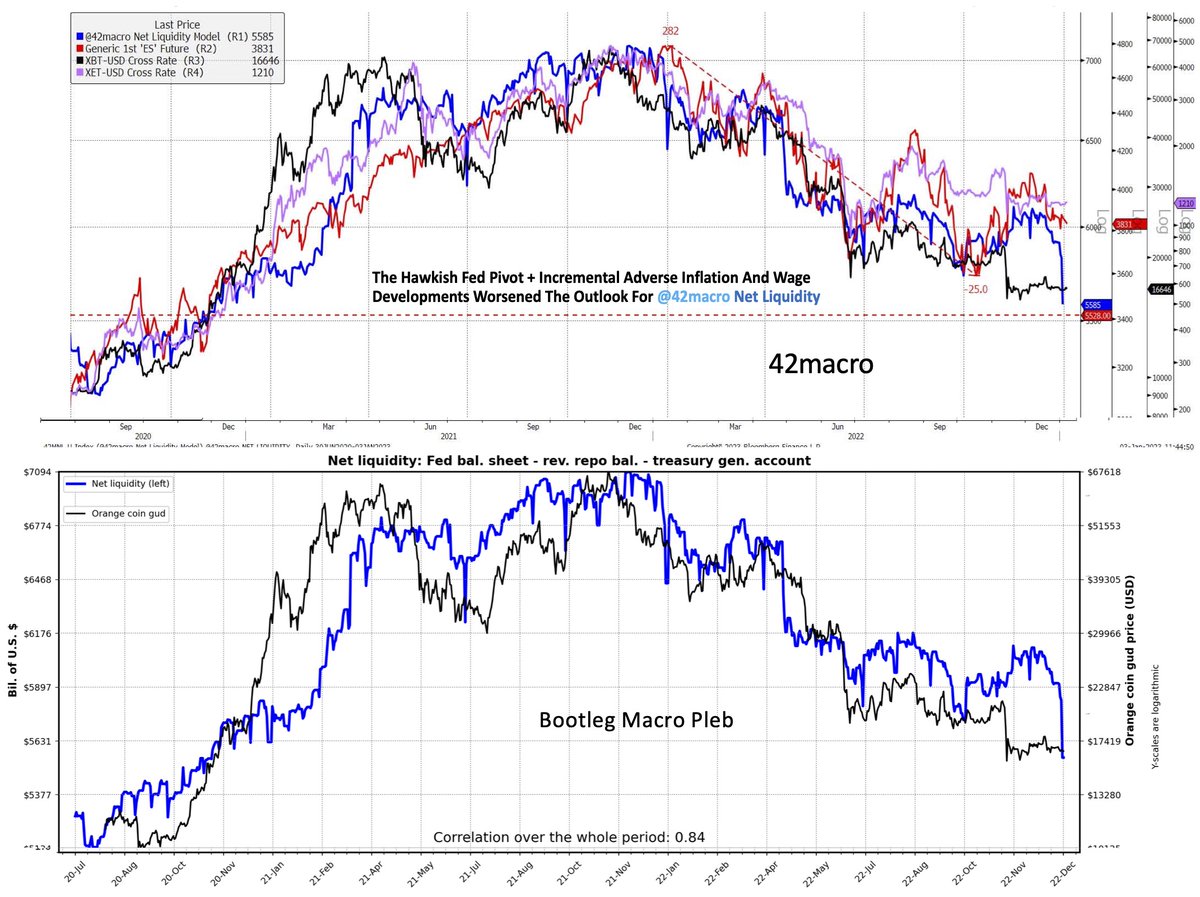
18/ So now you can track net liquidity on a daily basis with no subscriptions required. Let me know how how it works for you & contact me with any error messages or bugs that you find. It still needs testing on OS other than mac.
19/ Here’s some good threads about net liquidity other than @maxjanderson thread which is the best.
https://twitter.com/TimmerFidelity/status/1617934127616983040?s=20&t=vBf3LXuHw-U4X9s0fn5ZiA
https://twitter.com/Asymmetry_Fi/status/1615021057819148295?s=20&t=vBf3LXuHw-U4X9s0fn5ZiA
20/ I think Darius Dale and @42MacroAlerts originally formulated this metric. Here’s the man himself discussing NLQ with Jack Farley (towards end of episode):
https://twitter.com/ForwardGuidance/status/1616117654720483329?s=20&t=vBf3LXuHw-U4X9s0fn5ZiA
21/ That's it 4 now. Please like & retweet the first tweet if satisfaction delivered. I plan to release a series of scripts like this for average plebs to access macro data that is not previously free. Follow me if you like the sound of that. Contact me if keen to collaborate 🤝
Tagging some Chads and Plebs for extra reach....
@tedtalksmacro @AndreasSteno @BobEUnlimited @pyquantnews @python_spaces @macrojack21 @MacroAlf @deerpointmacro @PauloMacro @RaoulGMI @mkuegi @DanielZirkel @thetrocro @CarlBMenger @mark_dow @1MarkMoss @RyanMale5
@TimmerFidelity
@tedtalksmacro @AndreasSteno @BobEUnlimited @pyquantnews @python_spaces @macrojack21 @MacroAlf @deerpointmacro @PauloMacro @RaoulGMI @mkuegi @DanielZirkel @thetrocro @CarlBMenger @mark_dow @1MarkMoss @RyanMale5
@TimmerFidelity
And more: @BlacklionCTA @monetarydivorce @JackFarley96 @dailydirtnap @WalkerAmerica
@LawrenceLepard @K_Dway23 @stackhodler @TgMacro @WarrenPies @barryknapp @MFHoz @WinfieldSmart @Chinchillah_ @CryptoTea_ @pippellia @dampedspring @PatrickCeresna @Dynamo_Patrick @KrownCryptoCave
@LawrenceLepard @K_Dway23 @stackhodler @TgMacro @WarrenPies @barryknapp @MFHoz @WinfieldSmart @Chinchillah_ @CryptoTea_ @pippellia @dampedspring @PatrickCeresna @Dynamo_Patrick @KrownCryptoCave
again:@ThorHartvigsen @invest_answers
@intocryptoverse @Sheldon_Sniper @thedefiedge @milesdeutscher @hmeisler @BillyBobBaghold @AgilePatryk @TheRealPlanC @Fibonaccious @LynAldenContact @CryptoHarry_ @SirWhiteRussian @EmilKalinowski @EconguyRosie @TechDev_52 @DoveyWan @fiatjaf
@intocryptoverse @Sheldon_Sniper @thedefiedge @milesdeutscher @hmeisler @BillyBobBaghold @AgilePatryk @TheRealPlanC @Fibonaccious @LynAldenContact @CryptoHarry_ @SirWhiteRussian @EmilKalinowski @EconguyRosie @TechDev_52 @DoveyWan @fiatjaf
Note: This was a redo of the same thread I dropped the day before. I found the chart pics I uploaded were low-res crap. These charts are higher res. Gotta have high resolution.
• • •
Missing some Tweet in this thread? You can try to
force a refresh