Tomorrow is #JobsDay, my favorite day of the month! Except that tomorrow's report is going to be so, so, SO annoying. Quick, nerdy thread on why:
First, population adjustments! For the January jobs data every year, @BLS_gov incorporates updated population estimates into the Current Population Survey (the source of data on the labor force, unemployment, etc).
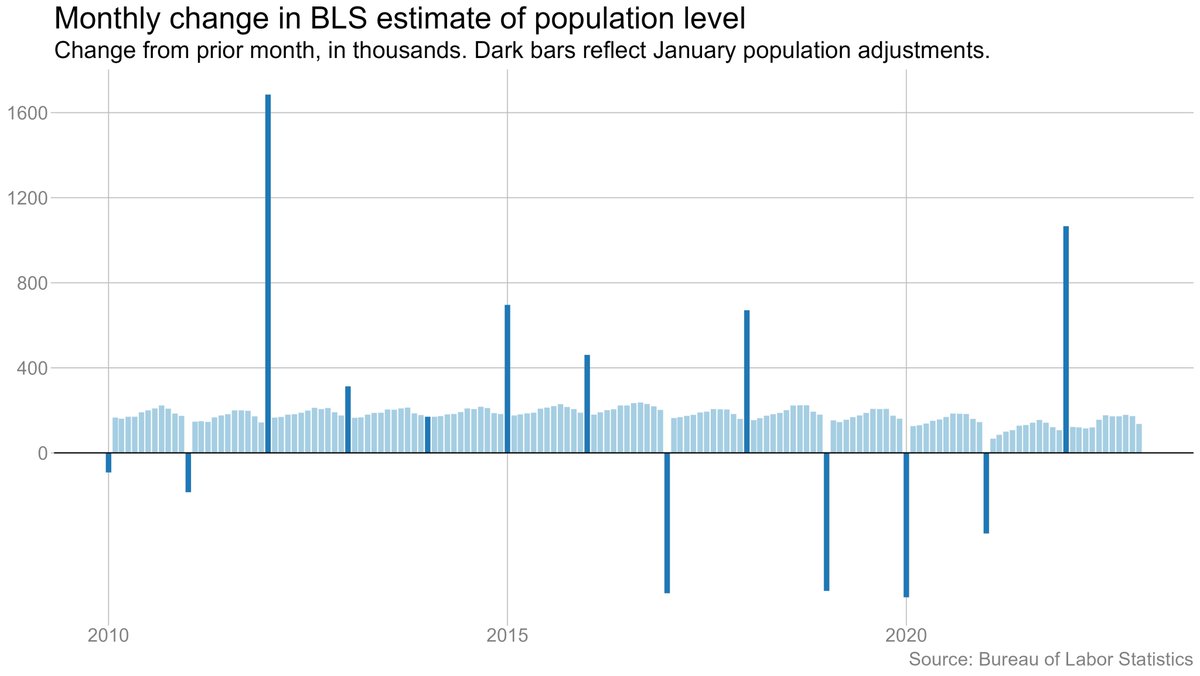
Importantly, BLS does *not* revise its previously published data -- it treats each year's adjustment as a one-time change, as if the population suddenly grew or shrank in January, as you can see in this chart. 

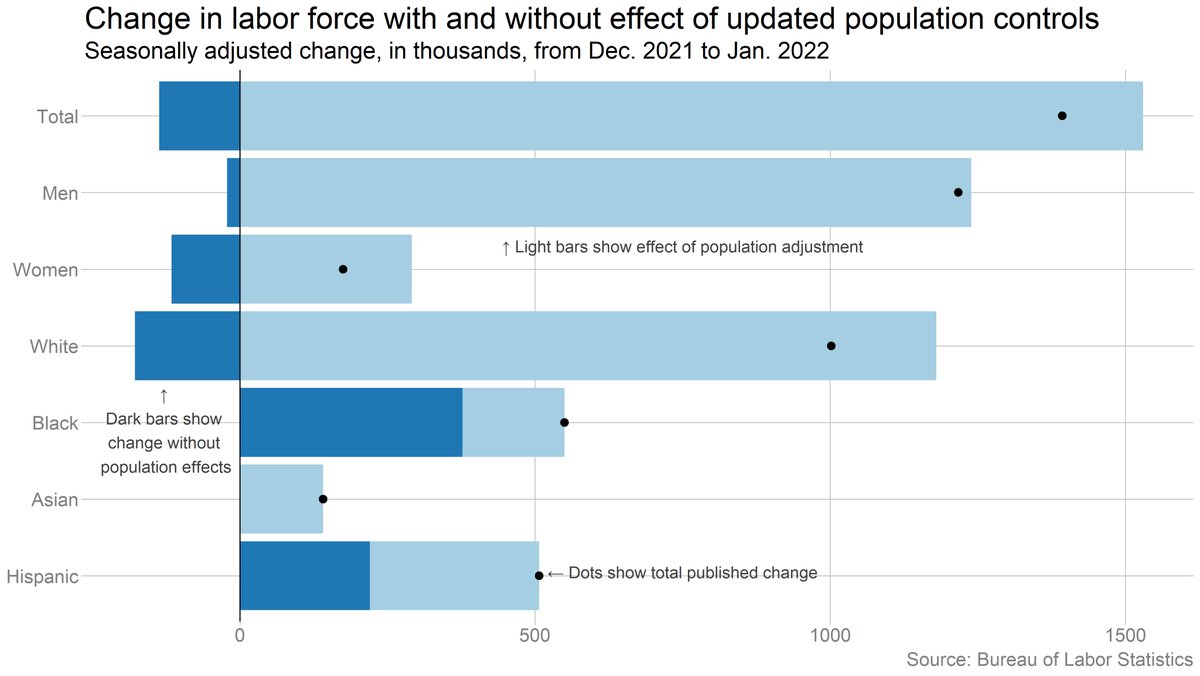
That means that the household survey estimates are NOT directly comparable between December and January. And sometimes, it can make a really big difference -- as it did last year, when if you missed the adjustments, you'd get the whole interpretation of the report wrong. 

Fortunately, BLS does publish estimates of the impact of the pop. adjustments on some of the most important data series. And as I'm sure @BenHanowell will remind us, we really shouldn't be focused on month-to-month changes in the CPS anyway. But still a pain.
Second, we *also* get the annual benchmark revisions tomorrow. This is when BLS reconciles survey-based payroll figures with more accurate (but less timely) data from state unemployment insurance systems.
BLS released preliminary revision estimates back in August, and they suggest we'll see a fairly large net revision (+462,000 jobs), plus some big shifts at the industry level (more jobs in warehouses, fewer in retail).
bls.gov/web/empsit/ces…
bls.gov/web/empsit/ces…
Thankfully, BLS *does* revise the establishment survey going back, so we'll be able to make historical comparisons with the payroll figures (as long as you download all the data fresh on Friday).
But crucially, tomorrow's revisions only incorporate the more detailed data up through Q1 2022. An analysis of more recent data from the Philly Fed suggests the BLS overestimated job growth in Q2 -- but that won't show up until NEXT YEAR's revisions.
philadelphiafed.org/surveys-and-da…
philadelphiafed.org/surveys-and-da…
In other words, that big debate that's been bubbling up on #EconTwitter lately about which set of jobs numbers to believe? It won't be resolved for another year (at the earliest).
(As an aside, @BrettMatsumoto has done some good threads on why we should be cautious about how we interpret the quarterly QCEW data, so I wouldn't take that Philly Fed estimate as gospel.)
https://twitter.com/BrettMatsumoto/status/1603170666370551808
But wait, there's more! Tomorrow's report will *also* incorporate updated industry definitions. This won't affect the topline numbers, but it means essentially all the industry data will be revised going back more than 30 years.
The impact here is BROAD. BLS says that "Approximately 10 percent of CES employment was reclassified into different industries as a result of the revision." A lot of that will happen at very detailed industry levels that most people won't notice. But...
bls.gov/web/empsit/ces…
bls.gov/web/empsit/ces…
There are big changes in Retail and Information. BLS is killing off the "nonstore retailer" category to reflect the fact that nearly ALL retail now has an e-commerce component. Similar move with media, where they'll no longer have a separate category for online publishing.
Big picture: Be *extra* skeptical tomorrow if you see any big monthly changes that don't seem consistent with other evidence. That's always a good practice anyway given how volatile these numbers an be.
• • •
Missing some Tweet in this thread? You can try to
force a refresh


