I got a little excited about the S&P500 going up each day lately.
I feel like I’m missing out, a guess like a @agnostoxxx’s monkeys.
So I consider buying some here. But what is it worth? I don’t know and nobody on CNBC wants to tell me.
1/n #SPX
I feel like I’m missing out, a guess like a @agnostoxxx’s monkeys.
So I consider buying some here. But what is it worth? I don’t know and nobody on CNBC wants to tell me.
1/n #SPX
So I decided to look at SPX like a giant American Corporation (let me call it “ACo”) with a market cap of US$33 trillion - genius, isn’t it?
2/n
2/n
At any one point, I can buy or sell ACo. Thereby the market offers me a price/share - currently US$ 4,410.
In return, I receive a value per share. Isn’t that how it works? Price is what I pay, value is what I get?
3/n
In return, I receive a value per share. Isn’t that how it works? Price is what I pay, value is what I get?
3/n
So I looked at the financials of ACo (SPX) and its FCF. Also, I know, I need to know the price of money.
After all, my alternative is to buy the US 10Y Treasury risk free - genius again!
4/n
After all, my alternative is to buy the US 10Y Treasury risk free - genius again!
4/n
Let me tell u: ACo is a wonderful company. I checked. It produces countless product & service we use daily.
iPhones or Software so I can do this; petroleum products; cars; food; banking, insurance, health care services; it even builds houses. I love that …!
5/n
iPhones or Software so I can do this; petroleum products; cars; food; banking, insurance, health care services; it even builds houses. I love that …!
5/n
It gets better. ACo achieves great margins, suggesting it has a moat. So wide that it returns 20cent for each $ of shareholder capital invested.
Ok, it does not mean mgmt returns it to me. They mostly keep it to expand the business & make more $, so they explained.
6/n
Ok, it does not mean mgmt returns it to me. They mostly keep it to expand the business & make more $, so they explained.
6/n
Anyway, after checking it all out I’m convinced ACo has wide moat around its economic castle which will allow it to defend its revenue growth, margins & cost for 30 years.
American Corporation is bad ass good. I’m trigger happy…! Check for yourself…!
7/n
American Corporation is bad ass good. I’m trigger happy…! Check for yourself…!
7/n

In fact, for my DCF I will assume ACo will grow as fast as it did bw 2015-2019 while retaining 11% FCF to sales margin until 2030.
Let’s make America great again.
8/n
Let’s make America great again.
8/n
Ok, I think I’m better off to allow for margins to reduce a tiny bit after 2030.
I mean ACo will not invent a new iPhone each decade. Also, American presidents love to spend taxes. Then there is climate change. Re-building our energy system will squeeze margin a bit etc
9/n
I mean ACo will not invent a new iPhone each decade. Also, American presidents love to spend taxes. Then there is climate change. Re-building our energy system will squeeze margin a bit etc
9/n
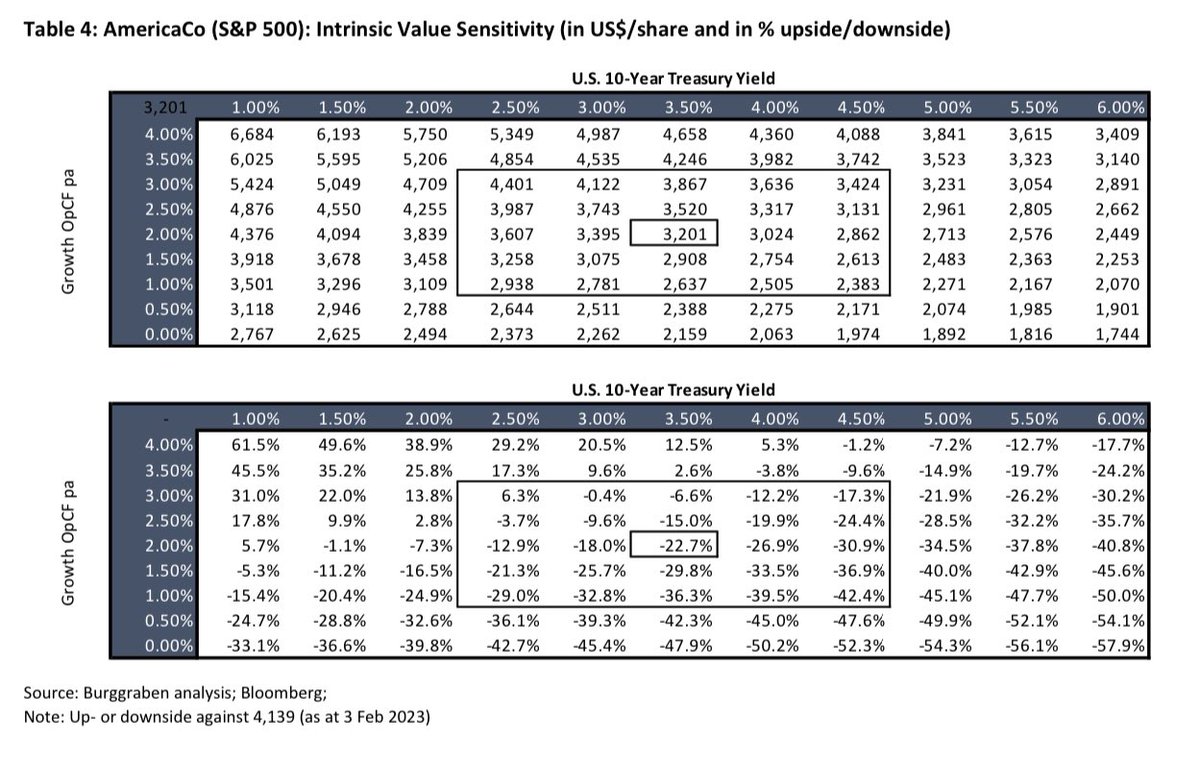
Lastly, I have to consider the cost of capital of which the 10-Year Treasury is part. Not a big deal.
The yield is currently 3.5%. But hey, it once was as high as 16%. That seems silly to me. I just ignore that and assume 3.5% to keep it simple.
What is ACo worth now?
10/n
The yield is currently 3.5%. But hey, it once was as high as 16%. That seems silly to me. I just ignore that and assume 3.5% to keep it simple.
What is ACo worth now?
10/n
Well, now I am lost. Why is everyone and their brother buying when my DCF says this ShitCo is worth only 3,201/share?
Why is this stonk trading at US$4,140/share? What if the 10Y goes to 4% or ACo margins contract?
11/n
Why is this stonk trading at US$4,140/share? What if the 10Y goes to 4% or ACo margins contract?
11/n
What am I missing @CathieDWood ? I’m lost @jimcramer ? Please advice?
Big kiss from the Swiss cowboy🇨🇭
12/n thx
Big kiss from the Swiss cowboy🇨🇭
12/n thx
• • •
Missing some Tweet in this thread? You can try to
force a refresh