Newly available Maxar satellite imagery shows several hundred meters long surface rupture with horizontal displacements up to 4m near Nurdağı, Gaziantep province, Turkey.
Here's a zoomed out version. Gaziantep Province is fractured, literally. I will certainly post more images in the next few days. Let's pray for Turkey...
New aerial images show a tens of km long surface rupture associated with the M7.8 Turkey earthquake near Tevekkelli, Kahramanmaraş. Credit: @trthaber
As some may have noticed (and contrary to what others may believe). This is not before/after imagery. A single Maxar image, captured after the earthquake (see details below) was used. I then processed it in Ps to put the terrain back to how it was before. That's it.
• • •
Missing some Tweet in this thread? You can try to
force a refresh
High-resolution satellite imagery of the French territory of Mayotte after Cyclone Chido is now available and I'm out of words to describe the devastation. Hundreds are feared dead.
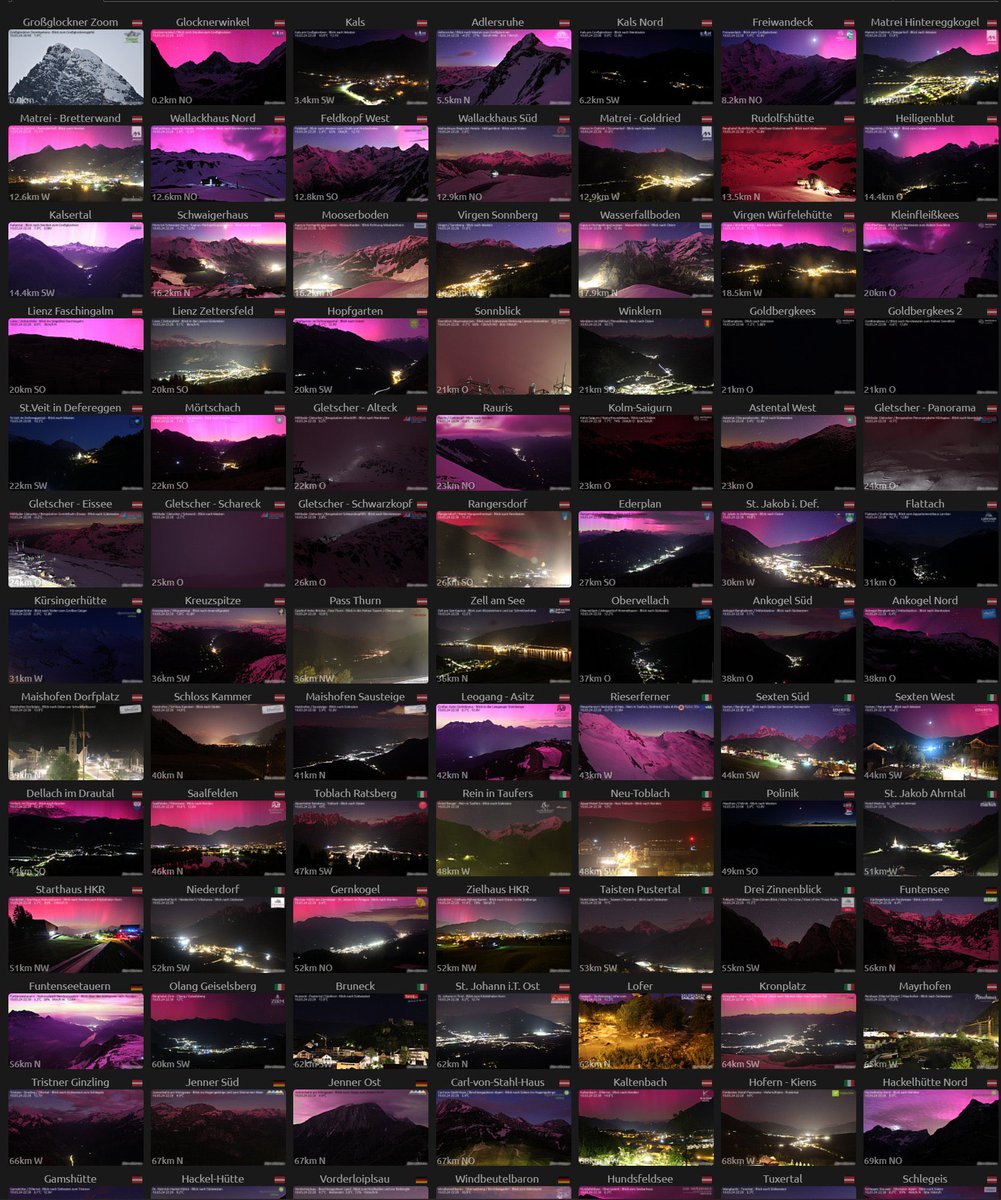
BREAKING: Thousands of reports of Northern Lights coming in from multiple locations across Europe. A severe G4 geomagnetic storm is currently affecting Earth. Truly the most stunning aurora show in years. Currently visible as far south as northern Italy.
New data collected by the Geospatial Information Authority of Japan reveals that approx. 90 km of the northern Noto Peninsula coastline has shifted offshore, exposing around 4 sq. km. of previously submerged land, following the Jan. 1st M7.6 earthquake.
A short thread.
In other words, Japan has actually gained approximately 4 km² of land area due to this earthquake. For perspective, Central Park in NYC is 3.41 km². On a national scale it's insignificant, but on the scale of a prefecture, it's obviously much more noticeable.
According to the official ranking of Japan’s 47 prefectures based on their surface area in km², Ishikawa, which features the most of the Noto Peninsula, is separated from Fukui by only 4.4 km². Coincidentally, this is exactly the area that Ishikawa gained from the sea.
The Mediterranean Sea is heading into uncharted territory. The recent powerful “heat dome” over southern Europe has led to an extremely rapid warming of the waters in the western part of the bassin, with SSTs now exceeding 30°C off the coast of southern Italy.
A short thread.
In case you didn’t know, sea surface temperatures usually peaks in late August in the Mediterranean Sea. As you can see from the graphic below, the Med. bassin has never been this warm so early in the year and is likely to break its all-time high in the next few days.
As you might expect, SSTs have warmed incredibly fast in the last few days. The recent extreme temperatures in the area has triggered a significant marine heatwave which is now spreading eastwards. Almost the entire Mediterranean basin will be affected.
This Sunday, January 15, will mark one year since the eruption of the Hunga Tonga–Hunga Haʻapai volcano shocked the world. I remember being awestruck by these images.
A short thread.
In the Volcanic Explosivity Index scale, the eruption was rated at least a VEI-5. It was the most powerful eruption since the 1883 eruption of Krakatoa with an estimated eq. TNT yield of 100-200 megatons, more than the Tsar Bomba, the most powerful nuclear weapon ever detonated.
Tonga volcano had the highest plume ever recorded. The column of ash reached almost 58km altitude (36 miles). After one hour, the cloud of volcanic ash was roughly 650km wide. For comparison, that's roughly size of mainland Spain. earthobservatory.nasa.gov/images/149474/…
Ce #Thread se focalisera exclusivement sur le paramètre « température » 🌡, je vous invite à lire le bilan climatologique de cet été 2022 signé @meteofrance qui aborde évidemment les autres variables du climat (précipitation, ensoleillement, indice d’humidité des sols…). ⤵️📖
Il ne s’agit évidemment pas de supplanter l’excellent travail déjà effectué par @meteofrance (et autres) mais de vous proposer de visualiser sous un autre angle la période que nous venons de vivre. Le visuel plus fort que l’écrit, parce qu’une data visualisation vaut 1000 mots…