Fibonacci Retracement and how I use this tool in with Supply & Demand levels?
A THREAD 🧵
(1/20)
#StockMarketindia #trading #StockMarket @sunilgurjar01 @kuttrapali26
A THREAD 🧵
(1/20)
#StockMarketindia #trading #StockMarket @sunilgurjar01 @kuttrapali26

Fibonacci Retracement is an important technical analysis tool used for charting potential Support and Resistance levels on any given chart.
These Fibonacci levels are also extremely important when trying to spot potential reversals within a chart. (2/20)
These Fibonacci levels are also extremely important when trying to spot potential reversals within a chart. (2/20)

These Fibonacci levels are based on a numerical sequence created by Leonardo Pisano in the 13th century.
The reason these levels hold weight or are significant, is because so many people use them. (3/20)
The reason these levels hold weight or are significant, is because so many people use them. (3/20)

The Fibonacci series is a sequence of numbers starting from zero arranged so that the value of any number in the series is the sum of the previous two numbers.
The Fibonacci sequence is as follows:
0 , 1, 1, 2, 3, 5, 8, 13, 21, 34, 55, 89, 144, 233, 377, 610….Infinity (4/20)
The Fibonacci sequence is as follows:
0 , 1, 1, 2, 3, 5, 8, 13, 21, 34, 55, 89, 144, 233, 377, 610….Infinity (4/20)
The Fibonacci numbers are the simplest sequence that obeys its particular pattern.
There are many, many ways to define the sequence, all of them setting it apart as being the simplest of the kind. (5/20)
There are many, many ways to define the sequence, all of them setting it apart as being the simplest of the kind. (5/20)
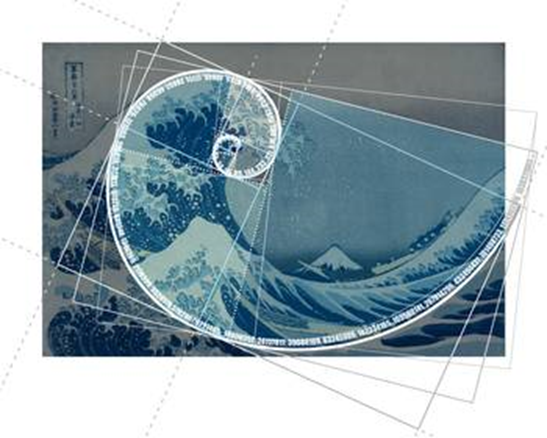

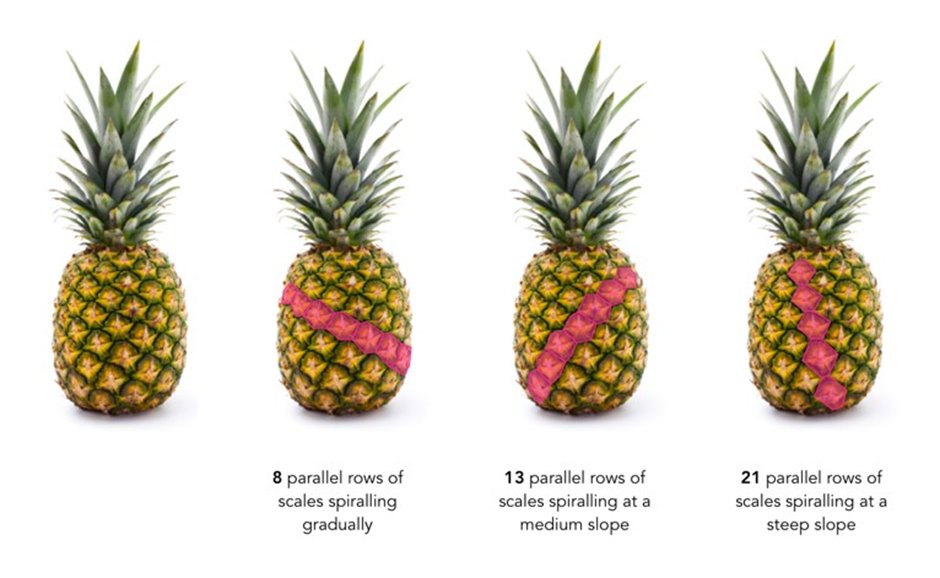
The Fibonacci number sequence describes how things grow, and also how they decay.
The sequence also describes growth within living things, for example the growth of a Nautilus shell.
So the formula for the sequence can be used to predict growth in living things. (6/20)
The sequence also describes growth within living things, for example the growth of a Nautilus shell.
So the formula for the sequence can be used to predict growth in living things. (6/20)

It is believed that the Fibonacci ratios, i.e. 61.8%, 38.2%, and 23.6%, finds its application in stock charts. Fibonacci analysis can be applied when there is a noticeable up-move or down-move in prices. (7/20)
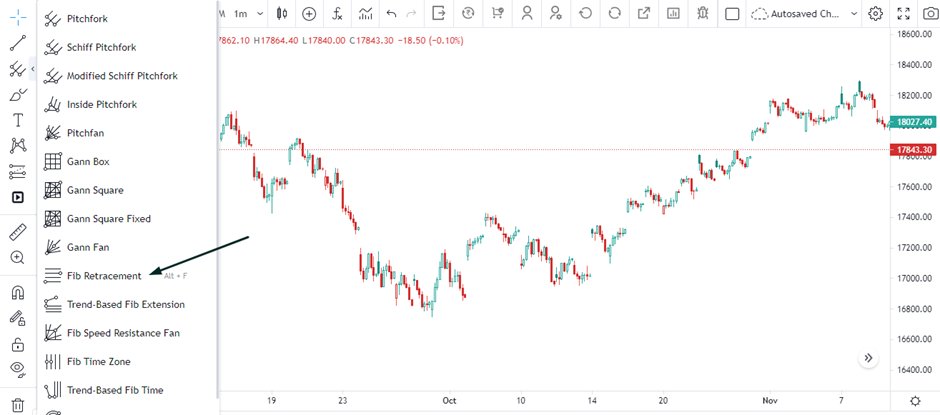
When it comes to plotting your Fibonacci Retracement lines, you must manually apply them to your charting. (8/20)
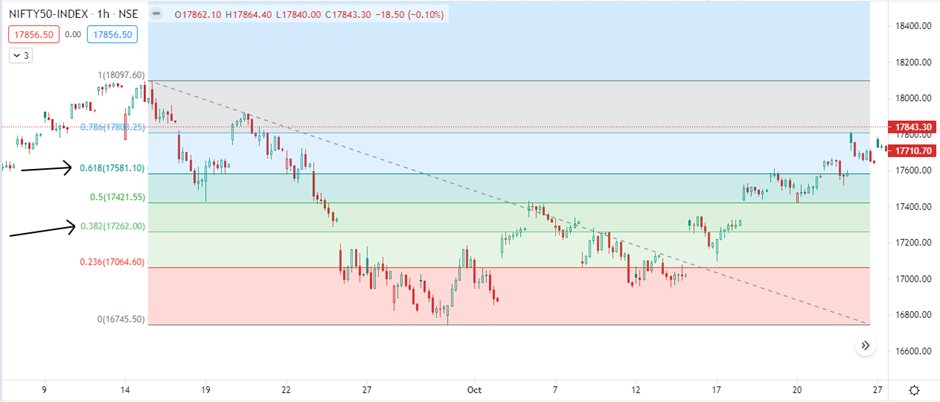
To manually plot fib lines, we must take the Retracement tool (Here I am using tradingview interface) and draw the levels starting from the top peak, down to the most bottom wick on our chart as pictured below. (9/20)
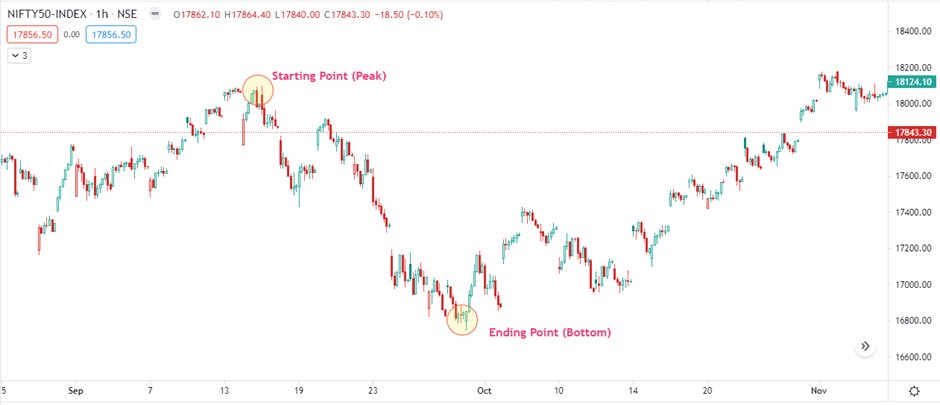
Here I am applying fib retracement in Nifty hourly chart.
We can use it in any stock and in any timeframe as per our requirement. (10/20)
We can use it in any stock and in any timeframe as per our requirement. (10/20)
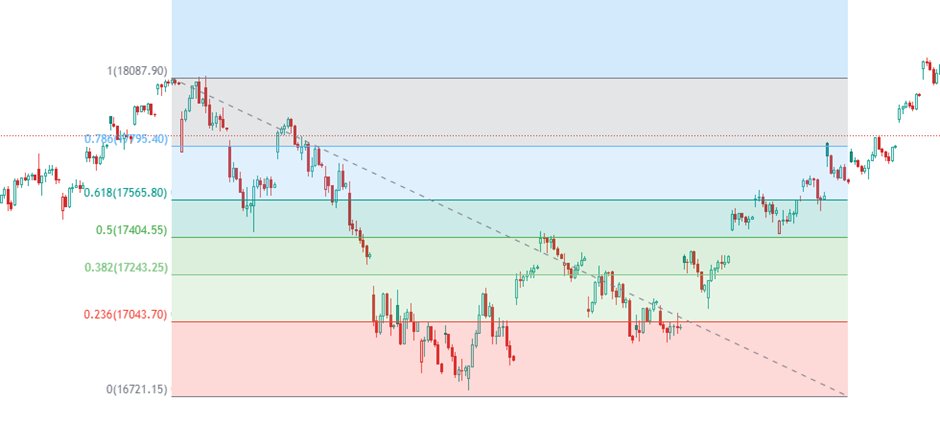
By applying our Retracement tool from the top to the bottom, this will plot and show us potential key support areas within our chart.
If we were to start the Retracement from the bottom to the top, this would then plot potential resistance areas instead. (11/20)
If we were to start the Retracement from the bottom to the top, this would then plot potential resistance areas instead. (11/20)
The most important Fibonacci numbers that hold the most weight are the 38.2% & 61.8% levels. These levels represent areas that hold the greatest significance in terms of acting as either support or resistance levels. (12/20)
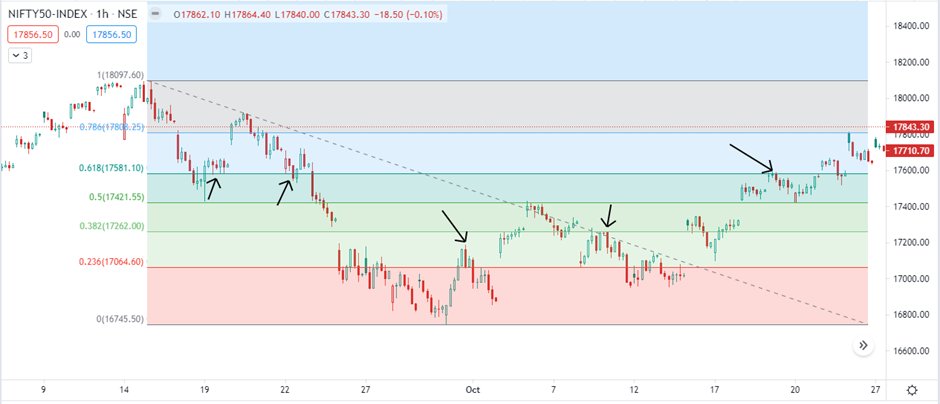
Now how do these levels corelate with Supply & Demand?
Well when plotting Fibonacci, specifically our 38.2% & 61.8% levels, we more often than not will see interaction with those levels creating at least a short term reversal. (13/20)
Well when plotting Fibonacci, specifically our 38.2% & 61.8% levels, we more often than not will see interaction with those levels creating at least a short term reversal. (13/20)
These reversals create an imbalance between buyers and sellers that results in the creation of Supply & Demand zones.
We can see few interactions below where zones were created off our key Fib levels. (14/20)
We can see few interactions below where zones were created off our key Fib levels. (14/20)
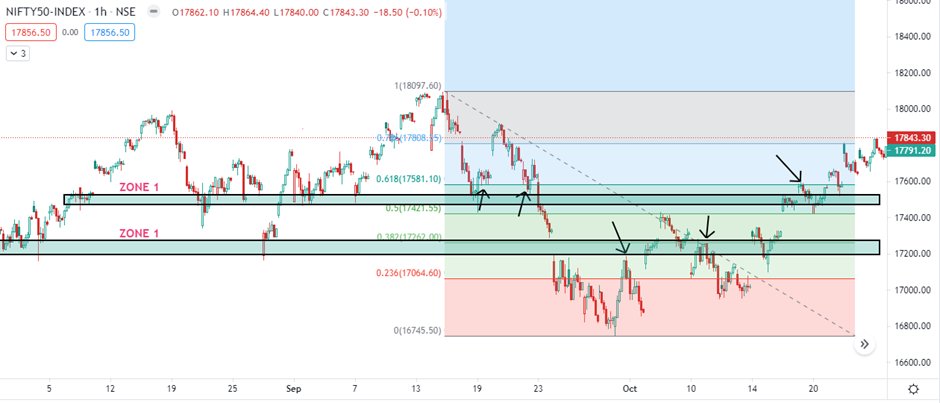
Once I see a reversal off a key Fib level, I then go in and manually apply my S&D zones.
It is also very important to cross confirm the levels for higher accuracy.
You can see an example of that below where I marked demand and supply zones manually. (15/20)
It is also very important to cross confirm the levels for higher accuracy.
You can see an example of that below where I marked demand and supply zones manually. (15/20)
✔Using Fibonacci and S&D together is a great way to take high probability trades backed with conviction. (16/20)
✔Entry & Stoploss
Fibonacci retracements can be used to place entry orders, determine stop-loss levels, or set price targets. For example, a trader may see a stock moving higher. After a move up, it retraces to the 61.8% level. Then, it starts to go up again. (17/20)
Fibonacci retracements can be used to place entry orders, determine stop-loss levels, or set price targets. For example, a trader may see a stock moving higher. After a move up, it retraces to the 61.8% level. Then, it starts to go up again. (17/20)
Since the bounce occurred at a Fibonacci level during an uptrend, the trader decides to buy.
The trader might set a stop loss at the 61.8% level, as a return below that level could indicate that the rally has failed. (18/20)
The trader might set a stop loss at the 61.8% level, as a return below that level could indicate that the rally has failed. (18/20)
✔Target/ Exit point –
I always follow next Fibonacci retracement level as my target. (19/20)
I always follow next Fibonacci retracement level as my target. (19/20)
♥If you found this thread useful, please RT the first tweet & follow @itsprekshaBaid for more such learnings.🔁 (20/20)
A Thread to learn : Simple Price Action - Swing Trading Strategy. 👇
https://twitter.com/itsprekshaBaid/status/1622137391007031296
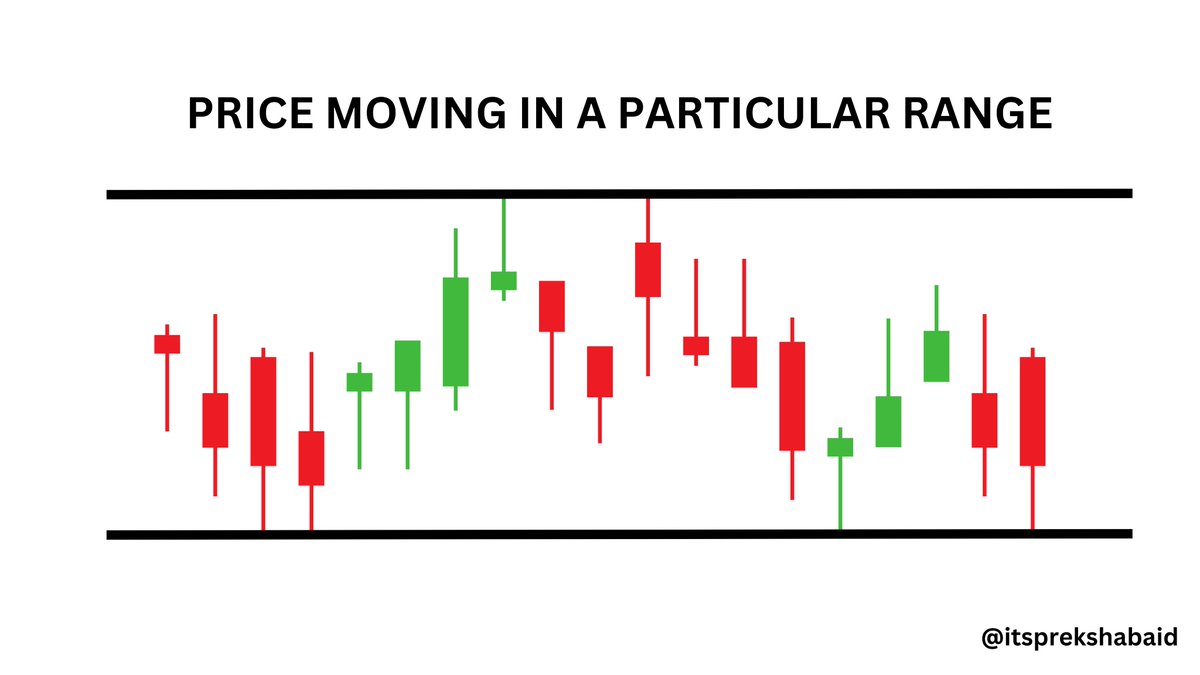
A Thread to learn : Simple range breakout strategy👇
https://twitter.com/itsprekshaBaid/status/1618246899760533504
• • •
Missing some Tweet in this thread? You can try to
force a refresh