Verified by #RetailSales

Bank of America credit and debit card spending per household rose 5.1% year-over-year (YoY) in January Image
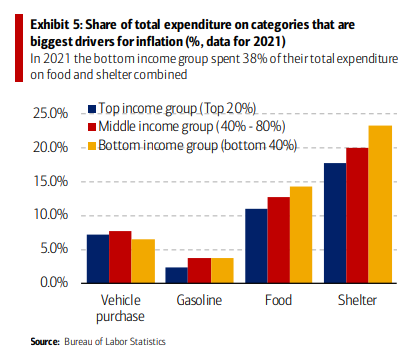
In 2021 the bottom income group spent 38% of their total expenditure on food and shelter combined Image
deposits remain above 2019 levels Image
For households with income of less than <$150k, the spending-tosavings ratio as of December 2022 remained lower than that of 2019 Image
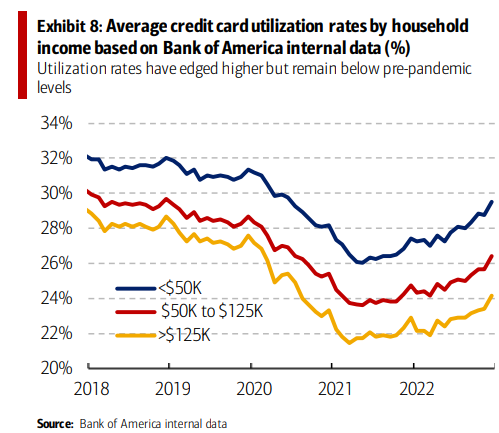
Credit Card utilization rates have edged higher but remain below pre-pandemic levels Image

• • •

Missing some Tweet in this thread? You can try to force a refresh
 

Keep Current with Mike Zaccardi, CFA, CMT

Mike Zaccardi, CFA, CMT Profile picture

Stay in touch and get notified when new unrolls are available from this author!

Read all threads

This Thread may be Removed Anytime!

PDF

Twitter may remove this content at anytime! Save it as PDF for later use!

Try unrolling a thread yourself!

how to unroll video
  1. Follow @ThreadReaderApp to mention us!

  2. From a Twitter thread mention us with a keyword "unroll"
@threadreaderapp unroll

Practice here first or read more on our help page!

More from @MikeZaccardi

Feb 18
The January report on producer prices topped expectations in both the headline and core PPI. Upstream price pressures persist.

@SoberLook charts
dailyshotbrief.com Image
Lithium prices have been rolling over. Image
After months of declines, new home prices were flat in January. Image
Read 5 tweets
Feb 17
450bp in 11 months… most aggressive Fed tightening in decades and…

US retail sales @ all-time highs, US unemployment @ 43 year lows, payrolls up >500k in Jan Image
BofA Bull & Bear Indicator: declines to 4.4,

down from 4.5 on easing momentum of EM equity inflows and bearish shift in hedge fund positioning. Image
we say H1’23 “no landing” = H2’23 “hard landing” for market & macro; no landing = higher rates

Hartnett BofA
Read 15 tweets
Feb 16
Goldman: We Lowered our Recession Odds to 25% Image
Goldman: Spinoff activity during 2022 surged by 33% and we expect these transactions will remain popular in 2023. Image
That's WACC:

12-month change in S&P 500 WACC remains elevated Image
Read 6 tweets
Feb 15
Housing continues to drive core inflation. They should just use Zillow numbers. @SoberLook charts
dailyshotbrief.com Image
Stocks have been remarkably resilient in the face of rising bond yields and higher Fed rate hike expectations. Image
More bad vibes..

S&P Global’s investment manager survey shows concerns about the market’s near-term performance. Image
Read 5 tweets
Feb 15
Market pricing of inflation over the next 12 months rose 18bps today and 87bps since the lows in January to 2.82% Image
Market pricing for the Fed policy rate in Dec-23 rose to 5.1% on Feb 14 from 4.7% on Feb 13

and 4.2% on Feb 2 (prior to January NFP report on Feb 3rd). Image
Moderate core services ex. shelter inflation in January Image
Read 7 tweets
Feb 14
Let's do a little technical analysis..

AAII Bullish Sentiment above resistance to confirm rally. Suttmeier BofA charts..
Asset manager SPX futures position remains bullish
S&P 500 back to 1928 with pullbacks and rallies along the way
Read 8 tweets

Did Thread Reader help you today?

Support us! We are indie developers!


This site is made by just two indie developers on a laptop doing marketing, support and development! Read more about the story.

Become a Premium Member ($3/month or $30/year) and get exclusive features!

Become Premium

Don't want to be a Premium member but still want to support us?

Make a small donation by buying us coffee ($5) or help with server cost ($10)

Donate via Paypal

Or Donate anonymously using crypto!

Ethereum

0xfe58350B80634f60Fa6Dc149a72b4DFbc17D341E copy

Bitcoin

3ATGMxNzCUFzxpMCHL5sWSt4DVtS8UqXpi copy

Thank you for your support!

Follow Us on Twitter!

:(