All You Should Know About a Bull Flag Pattern.
Simple Way To Use.
No Indicator Used.
A THREAD 🧵
(1/16)
#StockMarketindia #trading #StockMarket
@sunilgurjar01 @kuttrapali26 @chartmojo
Simple Way To Use.
No Indicator Used.
A THREAD 🧵
(1/16)
#StockMarketindia #trading #StockMarket
@sunilgurjar01 @kuttrapali26 @chartmojo

The bullish flag pattern gets its name because it resembles a flag on a flag pole.
A steep vertical rise in price is followed by a period when the price remains bounded between 2 fairly close, roughly horizontal lines. (2/16)
A steep vertical rise in price is followed by a period when the price remains bounded between 2 fairly close, roughly horizontal lines. (2/16)

The pole represents the steep rise in price, and the flag represents the area between the 2 lines. (3/16)
The bull flag pattern is thought to suggest an uptrend:
when the price of the stock breaks the range, it will continue upwards.
This makes it a continuation pattern, which is a pattern that is thought to suggest that the price will continue to move in the same direction. (4/16)
when the price of the stock breaks the range, it will continue upwards.
This makes it a continuation pattern, which is a pattern that is thought to suggest that the price will continue to move in the same direction. (4/16)

A flag pattern takes time to develop.
They are not useful until their upper and lower trendlines are clear.
Even then, as with any investment, there could always be a negative outcome.
There should be enough consolidation of price so it can form a clear flag. (5/16)
They are not useful until their upper and lower trendlines are clear.
Even then, as with any investment, there could always be a negative outcome.
There should be enough consolidation of price so it can form a clear flag. (5/16)
✔How to identify?
Step 1 : The first step in identifying the pattern is to locate the pole, which is representative of a significant rise in the stock price and is the starting point in the formation of the pattern.
(Let's understand it with Adani Enterprise stock chart) (6/16)
Step 1 : The first step in identifying the pattern is to locate the pole, which is representative of a significant rise in the stock price and is the starting point in the formation of the pattern.
(Let's understand it with Adani Enterprise stock chart) (6/16)

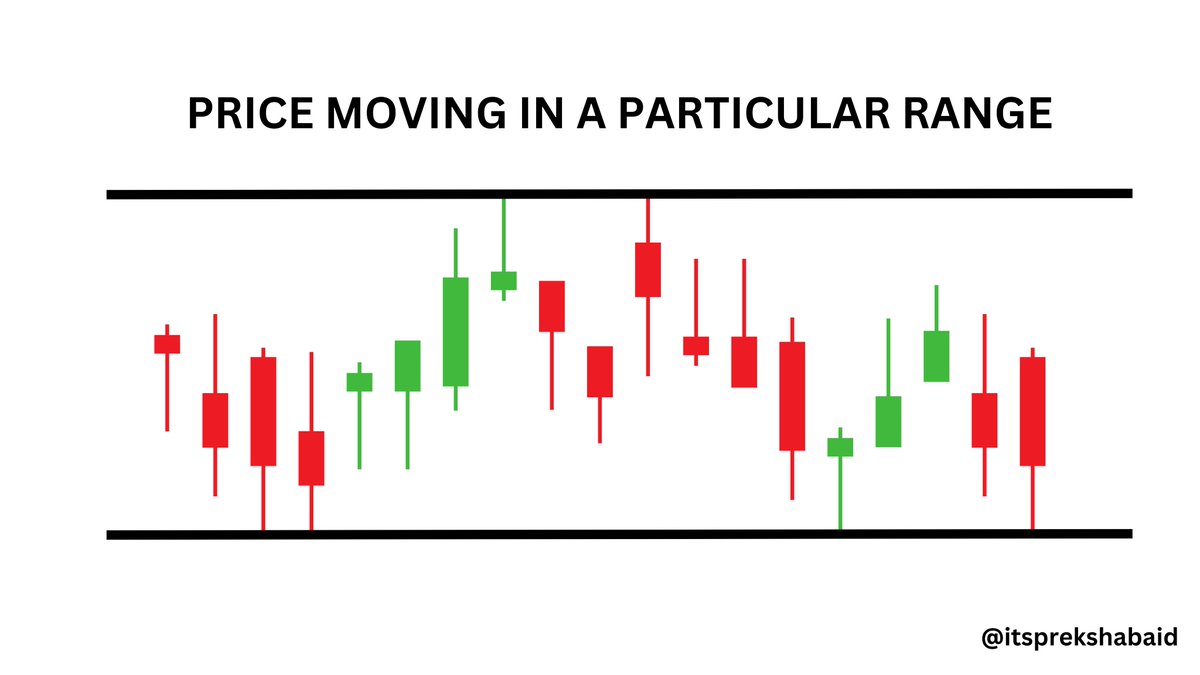
Step 2: Once the pole is found, identify the range of consolidation.
Prices will likely fluctuate during this stage before they begin trending upwards, assuming the bull flag does what is expected. (7/16)
Prices will likely fluctuate during this stage before they begin trending upwards, assuming the bull flag does what is expected. (7/16)

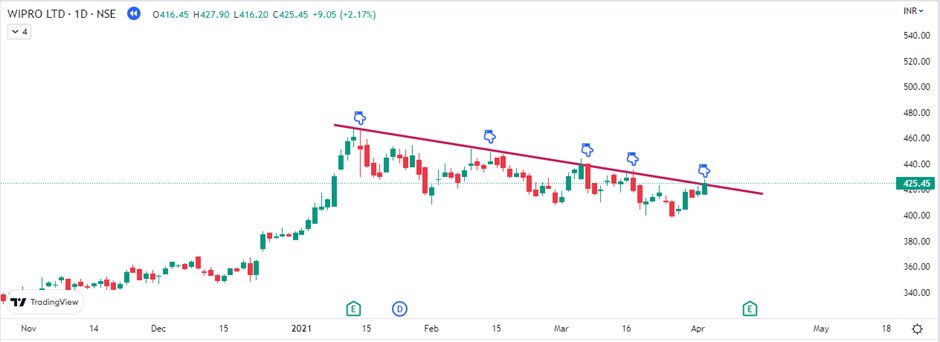
Step 3: When the price consolidate in a range, it forms a resistance line at the higher end, while the lower end is the support line.
We have to mark them with a horizontal line. (8/16)
We have to mark them with a horizontal line. (8/16)

Step 4: When the stock price breaks above the resistance level and continues in an upward trend, the pattern has been established. (9/16)

✔Entry point :
Once the price closes above the resistance line, take entry after the confirmation.
For confirmation : Wait for second candle to close above the breakout candle.
Confirmation always protect from fake breakouts. (10/16)
Once the price closes above the resistance line, take entry after the confirmation.
For confirmation : Wait for second candle to close above the breakout candle.
Confirmation always protect from fake breakouts. (10/16)

✔Retest level: If you missed to add stock at breakout level, retest can be the best level where risk reward ratio is highly favourable.
If the retest holds the breakout level, the price can take support and continue to rise in upward direction. (11/16)
If the retest holds the breakout level, the price can take support and continue to rise in upward direction. (11/16)

✔Wait with patience for the up move. (12/16)
Some key points to remember:
✔As the pattern is retraced, the line of flag should not move below half of the pole. If it does, it’s not considered aa a flag pattern.
✔The pattern should have parallel lines to form the flag. (13/16)
✔As the pattern is retraced, the line of flag should not move below half of the pole. If it does, it’s not considered aa a flag pattern.
✔The pattern should have parallel lines to form the flag. (13/16)

✔Stoploss: Once the price gives breakout, stoploss can be placed below the breakout candle or at the flag support.
Price should not come again in the flag range, else the breakout will fail and stock may continue to be rangebound and it may approach flag support again.(14/16)
Price should not come again in the flag range, else the breakout will fail and stock may continue to be rangebound and it may approach flag support again.(14/16)
Target/ Exit point –
✔The size of pole can be the target which we can expect after the breakout.
✔I always follow next resistance level as my target.
✔Always mark strong resistance areas in your chart and use them as a target for a perfect exit. (15/16)
✔The size of pole can be the target which we can expect after the breakout.
✔I always follow next resistance level as my target.
✔Always mark strong resistance areas in your chart and use them as a target for a perfect exit. (15/16)

♥If you found this thread useful, please RT the first tweet & follow @itsprekshaBaid for more useful threads.🔁 (16/16)
A Thread to learn : Fibonacci Retracement and how I use this tool in with Supply & Demand levels? 👇
https://twitter.com/itsprekshaBaid/status/1624345560827445249
A Thread to learn : Simple range breakout strategy 👇
https://twitter.com/itsprekshaBaid/status/1618246899760533504
A Thread to learn : Simple Price Action - Swing Trading Strategy. 👇
https://twitter.com/itsprekshaBaid/status/1622137391007031296
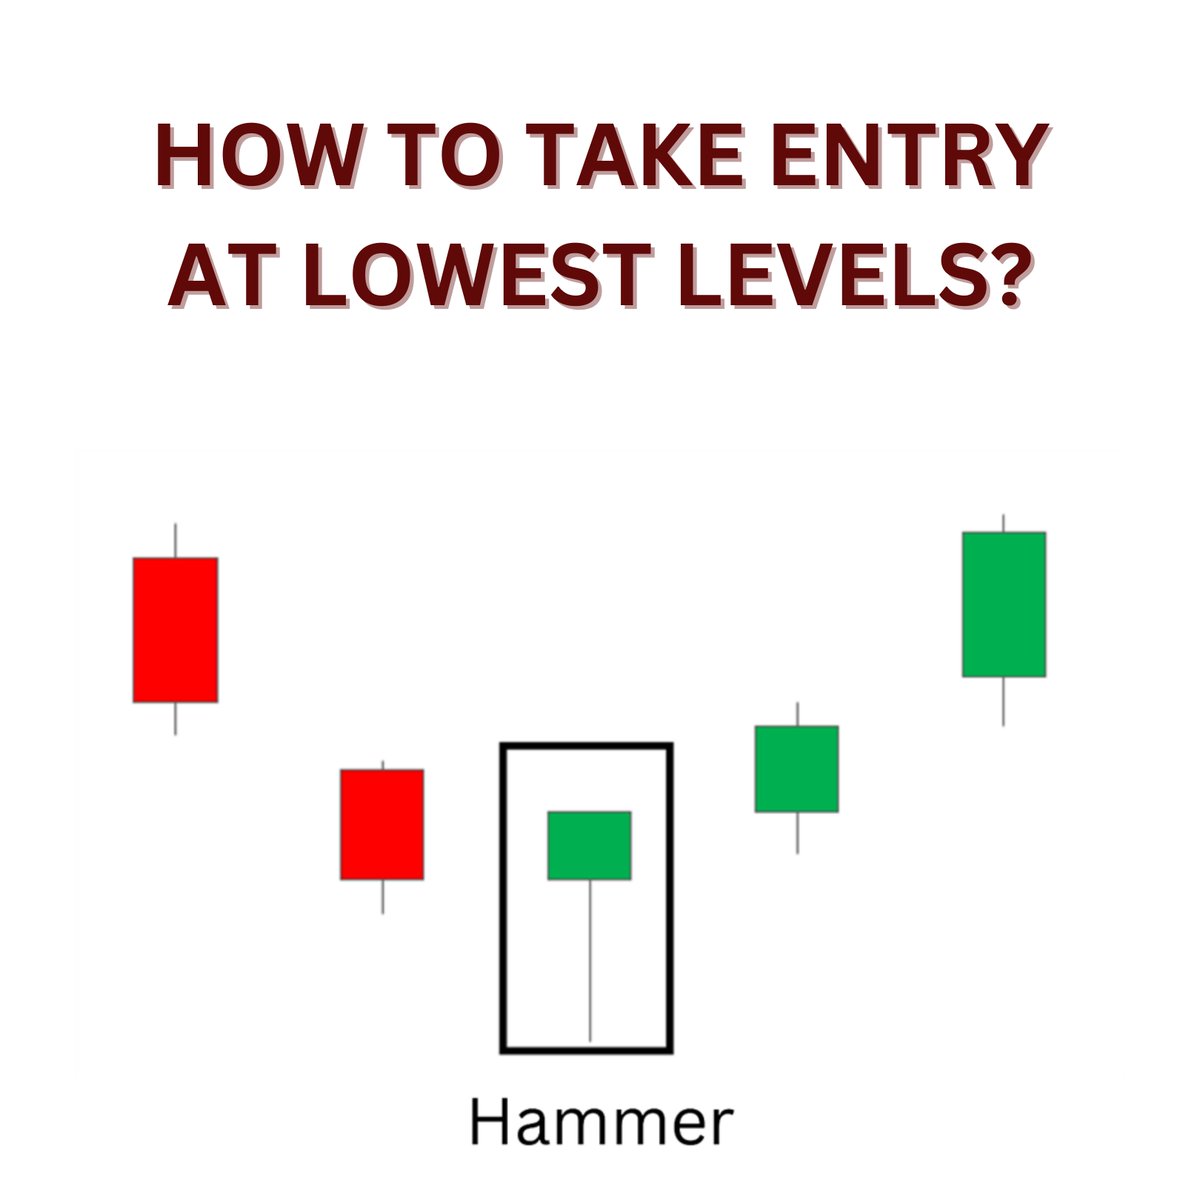
A Thread: To learn HAMMER candlestick pattern. 👇
https://twitter.com/itsprekshaBaid/status/1613103854870200321
A thread: To learn BULLISH ENGULFING candlestick pattern. 👇
https://twitter.com/itsprekshaBaid/status/1611971054347644929
• • •
Missing some Tweet in this thread? You can try to
force a refresh