New cheese 🧀🧀🧀
For those enquiring about whether hospital episode statistics confirm an increase in miscarriages... the data is early.
NHS data only goes up to March 2022.
It's massively confounded but read on.
Here is "bleeding in early pregnancy" (O20)
7-sigma increase
For those enquiring about whether hospital episode statistics confirm an increase in miscarriages... the data is early.
NHS data only goes up to March 2022.
It's massively confounded but read on.
Here is "bleeding in early pregnancy" (O20)
7-sigma increase
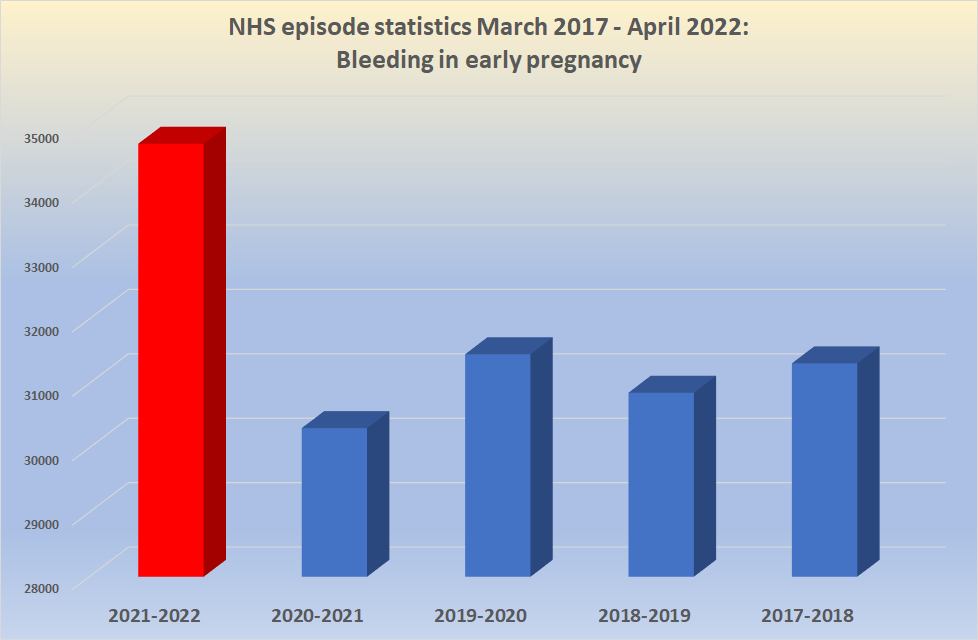
NHS episode statistics 2017-2022:
"Ectopic pregnancy" ICD code O00.
7 sigma increase.
"Ectopic pregnancy" ICD code O00.
7 sigma increase.

NHS episode statistic 2017-2022:
"Maternal care for fetal problems"
ICD code O36.
4.7 sigma increase
There are others, e.g. diabetes (7.1 sigma increase)
"Maternal care for fetal problems"
ICD code O36.
4.7 sigma increase
There are others, e.g. diabetes (7.1 sigma increase)

But there are two codes which behave very oddly, that based on the other codes you would expect a rise but are either the same or lower number of episodes.
There is an explanation so hold on...
Here is "spontaneous abortion" aka miscarriage.
There is an explanation so hold on...
Here is "spontaneous abortion" aka miscarriage.

The miscarriages are higher than the previous year (when there were more pregnancies) but lower than the previous years.
What's going on?
Why did miscarriages fall so dramatically in 2020?
What's going on?
Why did miscarriages fall so dramatically in 2020?
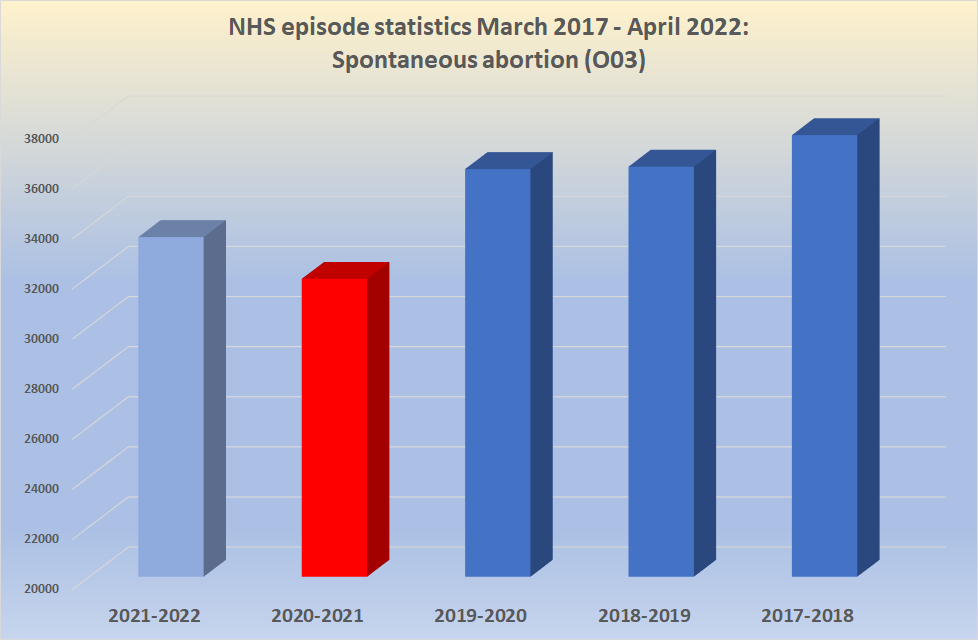
The clue lies in O04 - complications of induced abortion. These *halved* suddenly in 2020. Why?
In 2020, the same NHS who told you to stay at home if you had pneumonia also told you to keep out of the hospital for your abortion.
In 2020, the same NHS who told you to stay at home if you had pneumonia also told you to keep out of the hospital for your abortion.

Where abortion care moved to the community it did not generate a hospital episode, so the number of hospital episodes went down.
The same with miscarriages.
pubmed.ncbi.nlm.nih.gov/33893642/
The same with miscarriages.
pubmed.ncbi.nlm.nih.gov/33893642/

Good luck getting the information on miscarriage numbers outside of hospital since 2020. Conveniently the ONS "do not hold this information"
ons.gov.uk/aboutus/transp…
ons.gov.uk/aboutus/transp…

So all we can say is that under the likely same circumstances, hospital managed miscarriages are 5% up on the previous year, and we do not know how many were managed in the community.
We can try and adjust for the drop in 2020 which would look a bit like this...
We can try and adjust for the drop in 2020 which would look a bit like this...
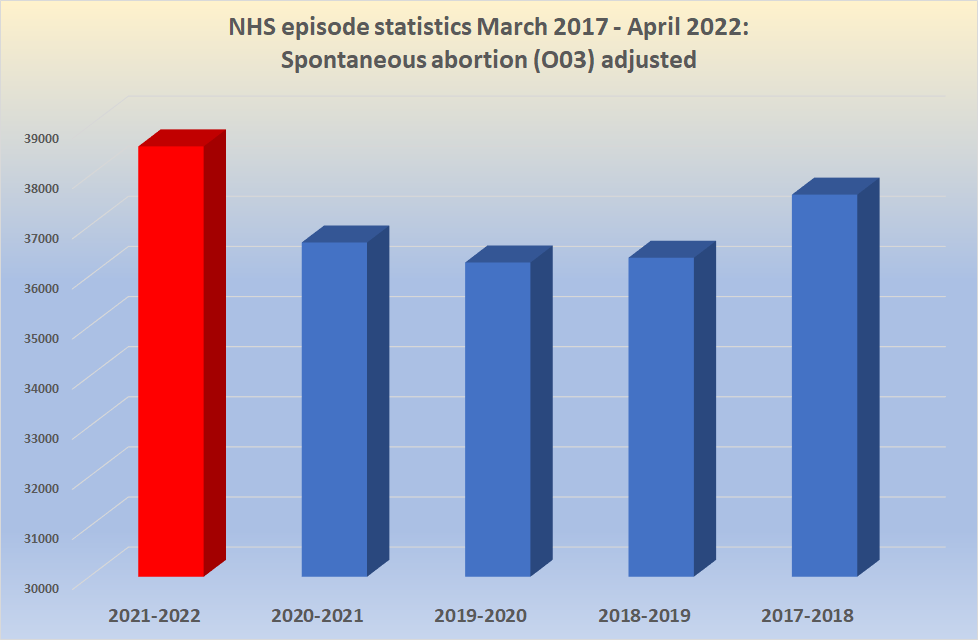
What we can say though is that many of the complications of #pregnancy that must be managed in hospital, such as ectopic pregnancy, have increases that are unprecedented (7-sigma).
Despite a drop in birth numbers.
That's a massive safety signal.
Despite a drop in birth numbers.
That's a massive safety signal.
And remember that most of the COVID vaccinations given in pregnancy were in the 2nd-3rd trimester, where they don't influence miscarriage rates.
A *doubling* of the miscarriage rate from 10% to 20% in 10% of pregnancies would give a graph that looked something like...
Yep.
A *doubling* of the miscarriage rate from 10% to 20% in 10% of pregnancies would give a graph that looked something like...
Yep.

And even without adjusting for community cases, if 5% of women received a COVID vaccine in the first trimester and the miscarriage rate doubled from 5% to 10% you would get a 5% rise from the previous year's numbers.
Exactly the figure seen (see ALT text for calculation)
Exactly the figure seen (see ALT text for calculation)

Source for the above all taken from NHS digital hospital admitted care activity:
@ClareCraigPath @joshg99 @MartinNeil9 @RealJoelSmalley @EthicalSkeptic @boriquagato
digital.nhs.uk/data-and-infor…
@ClareCraigPath @joshg99 @MartinNeil9 @RealJoelSmalley @EthicalSkeptic @boriquagato
digital.nhs.uk/data-and-infor…
• • •
Missing some Tweet in this thread? You can try to
force a refresh