#BankNiftyOptions #IronFly
On popular demand I am sharing the adjustments I made to get out with good profits.
1) BNF started trending - brought the CE buy leg inside to 41000CE (at 9:27)did not exit 41100CE (delayed shifting)
2) Naked selling 40600PE (at 9:42 ) using #DOS
+2/n
On popular demand I am sharing the adjustments I made to get out with good profits.
1) BNF started trending - brought the CE buy leg inside to 41000CE (at 9:27)did not exit 41100CE (delayed shifting)
2) Naked selling 40600PE (at 9:42 ) using #DOS
+2/n
https://twitter.com/dtbhat/status/1631260367279226880
+2/n
3) exited 41100CE (10:03) and added 40600PE (at 10:22)
4) Now thought of adding a broken wing fly at 41000 (at around 10:22). Brought the buy wing to 40900CE
5) Abandoned the idea and closed 40900CE and 40500CE (part of original IFLY at 10:25)
+3/n
3) exited 41100CE (10:03) and added 40600PE (at 10:22)
4) Now thought of adding a broken wing fly at 41000 (at around 10:22). Brought the buy wing to 40900CE
5) Abandoned the idea and closed 40900CE and 40500CE (part of original IFLY at 10:25)
+3/n
3/n
6) Created a debit spread at 41000CE - 41500CE
shorted 41500CE (at 10:27)
7) BN was nicely trending- did delta drifting to 41100CE, 41200CE
8) At this stage thought BN might do mean reversal and prepared for creating BFLY at 41300-41500-41700. So bought 41700CE (11:36)
+4/n
6) Created a debit spread at 41000CE - 41500CE
shorted 41500CE (at 10:27)
7) BN was nicely trending- did delta drifting to 41100CE, 41200CE
8) At this stage thought BN might do mean reversal and prepared for creating BFLY at 41300-41500-41700. So bought 41700CE (11:36)
+4/n
4/n
9) Abandoned the idea and decided to book fully (12:35) except some 40600PE shorts
10) exited naked 40600PE finally at 15:20
I have mentioned the time of adjustments so that you can check the BN spot chart (5 min TF) and relate my adjustments to price action/price flow.
9) Abandoned the idea and decided to book fully (12:35) except some 40600PE shorts
10) exited naked 40600PE finally at 15:20
I have mentioned the time of adjustments so that you can check the BN spot chart (5 min TF) and relate my adjustments to price action/price flow.

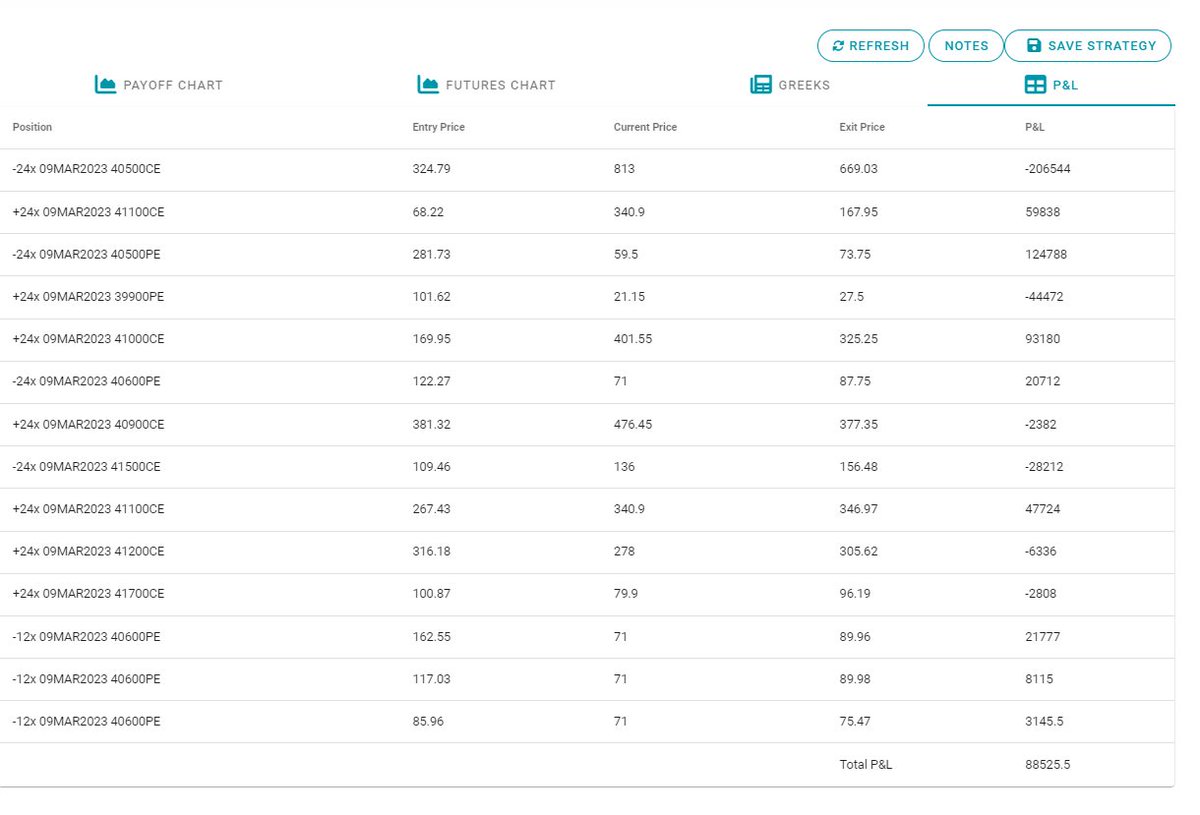
Details of entry and exit prices. Max capital used may be around 80L. It was in a large account and not bothered to buy far OTM hedges, capital was not an issue for this position size. 

• • •
Missing some Tweet in this thread? You can try to
force a refresh


