Tweeting about Excess Mortality, I sometimes encounter strong vibes by "liberal statisticians™" telling me of all my calculations are very, very bad and wrong 😱 because I do not consider aging of population.
(Short answer: Nope)
🧵

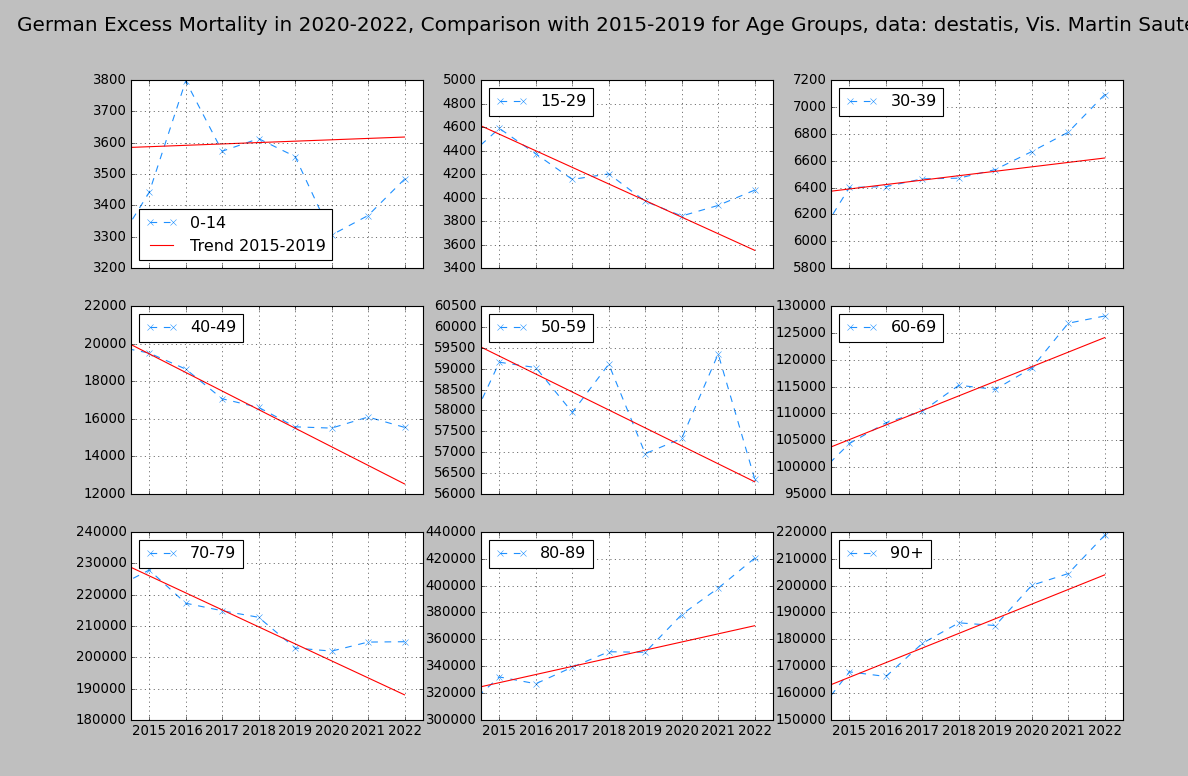
What I usually do: I calculate trend from death numbers - this is a very precise metric and I extrapolate by a linear model.
This works well, this can also be done by excel or other tools.
For Germany this looks as follows:
2/N Image
3/N "Age standardisation" is often told to be the "gold standard" for mortality metrics. You can find a description here:
health.mo.gov/data/mica/CDP_…
4/N You calculate deaths per population for defined age bands. Afterwards you normalise these values to a "standard population" which you assume to be constant in the time interval you look at.
This means, that you assume age distribution to be constant during the time.
5/N Which means you "calibrate" out effects of population aging.
I took the data of two other mortality trackers and compared the deviation from predicted linear trend for the pandemic years.
6/N For calculation I took a relative "overshoot" from the expected value (This term comes from signal processing but I think it can be understood quite intuitively)
7/N Look at this by @ProfStefanKraus (right picture) is age standardised mortaility rate, normalised to 2021. He uses german population from 2021 as standard. Image
8/N Typing these values into my #python program I extrapolate as relative excess:
3.7% / 7.3% / 9.9% Image
9/N which is even higher than the values I calculate from death numbers. Anyway, both calculations match quite well. Image
10/N And here, calculated by @dobssi for Germany using european standard population from 2013: Image
11/N These values are quite different (pls note that here the last 3 weeks with a very many excess deaths are not within this graph)
12/N Paul @dobssi also was so kind to provide me with his calculations for Sweden (Thx for sharing #openscience !) Here come the calculations for death numbers, "crude" mortality and standardised mortality: Image
13/N And we see: Extrapolation from ASMR and Death numbers come together very, very close.
14/N So we see, choice of standard population affects the calculated ASMR.
My suspicion is that the distribution in the age bands makes the difference.
15/N What you calibrate away by using ASMR is the trend of shift in population towards older group. What you see afterwards is the effect of better life conditions and improved healthcare, which leads to a higher life expectancy.
16/N But this is not really necessary, because in 2020 to 2022 you have higher jumps in mortality due to the emergence of SarsCoV2. This effect is in the range of some percent and overrides slow happening demographic changes.
17/N So: There is no real necessity to do an ASMR calculation for estimating pandemic effects on excess mortality. All background demographic effects are included in the slope of death numbers and can easily be extrapolated.
//

• • •

Missing some Tweet in this thread? You can try to force a refresh
 

Keep Current with Martin Sauter

Martin Sauter Profile picture

Stay in touch and get notified when new unrolls are available from this author!

Read all threads

This Thread may be Removed Anytime!

PDF

Twitter may remove this content at anytime! Save it as PDF for later use!

Try unrolling a thread yourself!

how to unroll video
  1. Follow @ThreadReaderApp to mention us!

  2. From a Twitter thread mention us with a keyword "unroll"
@threadreaderapp unroll

Practice here first or read more on our help page!

More from @Martin__Sauter

Mar 7
Schweden hat (wie schon von anderen angemerkt - ht @dm_ms, vielen Dank!) Probleme bei der Meldung der Todeszahlen.
Die schwedische Statistikbehörde scb.de nennt auf Ihrer Webseite als Todeszahlen für 2022: 94737 Todesfälle.
(+)
@dm_ms Schaut man dagegen in die Zeitreihen für die wöchentlichen Todesfälle (dort bis zur KW51/2022) aufgelistet, dann kommt man lediglich auf 88576 Todesfälle (die fehlende Woche dürfte bei 2-3Tsd liegen)
(+)
Auch in der "Human Mortality Database" kommt man (bis zur KW50) auf 86186.
Die Differenz liegt daran, dass in diesen Datenbanken die Todesfälle mit unbekanntem Datum nicht eingearbeitet sind.
(+)
Read 6 tweets
Mar 6
This is really, really crap mathematics.
Cherrypicking directly coming out of hell.
Here's why:

1/N Image
Look at death numbers of e.g. Germany. Like most of all countries, these numbers have a strong and very stable rising trend - typical for Germany about 10.000 more per year (this is around 1%)

2/N
3/N You can correct this quite easily by using common tools for linear extrapolation, also available in Excel etc., like I did here.
For Sweden this is a bit different, because these numbers are not rising (or it is dependent of the prepandemic interval you use).
Read 8 tweets
Feb 26
Ich hatte in der Vergangenheit die Übersterblichkeit in Deutschland berechnet und hier dargestellt.
Meine Vorgehensweise besteht darin, die erfassten Todesfälle anzusehen, den Trend der Vorjahre zu betrachten und darauf basierend "gerade" weiter hoch zu rechnen.
🧵
2/N Die häufigste Kritik zu dieser Vorgehensweise besteht darin, dass diese Berechnung nicht die Altersentwicklung in der Bevölkerung mit berücksichtige. Sie kommt tendenziell von Leuten, die das Vorhandensein einer Übersterblichkeit (ÜS) generell bestreiten.
3/N Diejenigen berufen sich dabei auf eine wesentlich ausgefeiltere Methode, nämlich die Betrachtung einer "altersstandardisierten" Sterblichkeit.
Allerdings: Wenn man genau hinsieht, dann unterscheiden sich die Ergebnisse nur wenig.
Read 26 tweets
Jan 24
Excess Deaths in Germany for 2022, now calculated for age groups.
What happened: In 2020, XDs happened mainly in the group aged 80+.
For 2021 this effect diffused down to the younger groups - in 2022 it stayed there and became even stronger.
🧵
Picture composed of 9 plots:
2/
3/ Blue lines refer to the reported deaths of all causes. Red lines show a linear model for the prepandemic years from 2015 to 2019.
Read 7 tweets
Jan 24
Übersterblichkeit 2022 in Deutschland - jetzt die Aufschlüsselung nach Altersgruppen.
Was passiert ist: War in 2020 die ÜS im wesentlichen bei den 80+ zu sehen, so war sie 2021 auch in den jüngeren Altergruppen.
Dieser Effekt hat sich in 2022 verstetigt.
🧵
Hier mal die Tapete. Quelle: @destatis Sonderauswertung.
Berechung der erwarteten Sterbezahlen aus dem Trend der Vorjahre 2015 bis 2019.
2/
Nach wie vor: Der _absolute_ Großteil der ÜS ist bei den 80+ zu finden (über 50.000)
Die _relative_ Erhöhung (typischerweise 5-10%) findet man bei allen Altersgruppen.
Ausnahme: Kinder (0-15) und die 50-59 jährigen.
3/
Read 7 tweets
Jul 14, 2022
Der Tweet mit dem deutschen Impfatlas ist nun bei >1500 Likes und >300 RTs. Hat scheinbar einen Nerv getroffen.....
Die naheliegenden Fragen mehrerer Leser waren die Zusammenhänge mit den Erkrankungs- und Todesfällen.
(1)
(2) Mein sehr geschätzter Mit-Impftracker @impfstatistiken hat um den Jahreswechsel herum Karten dazu gemacht.
Fallquote (Skala bis 22%)
@impfstatistiken (3) Sterbequote
Read 10 tweets

Did Thread Reader help you today?

Support us! We are indie developers!


This site is made by just two indie developers on a laptop doing marketing, support and development! Read more about the story.

Become a Premium Member ($3/month or $30/year) and get exclusive features!

Become Premium

Don't want to be a Premium member but still want to support us?

Make a small donation by buying us coffee ($5) or help with server cost ($10)

Donate via Paypal

Or Donate anonymously using crypto!

Ethereum

0xfe58350B80634f60Fa6Dc149a72b4DFbc17D341E copy

Bitcoin

3ATGMxNzCUFzxpMCHL5sWSt4DVtS8UqXpi copy

Thank you for your support!

Follow Us on Twitter!

:(