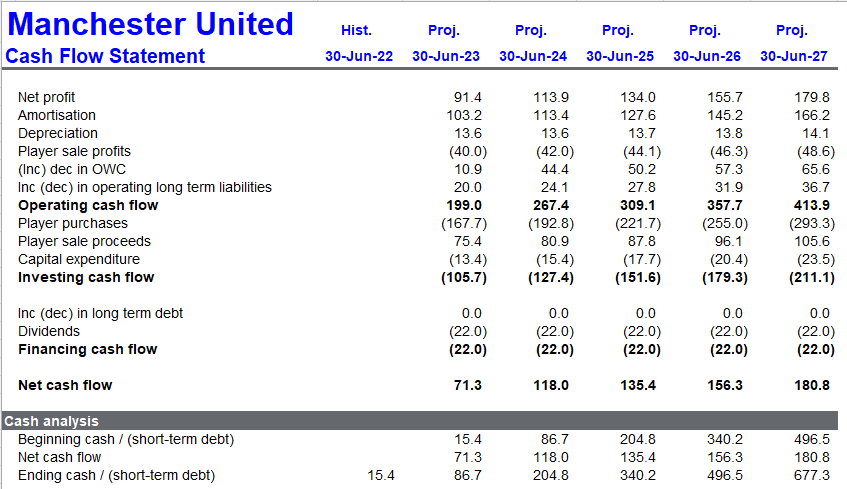
I was asked on @SkySportsNews why bidders not willing to match the Glazers' asking price of £6bn. This is one way how we crunch the numbers, the discounted cash flow model (DCF). First of all look at this historic performance of the club #MUFC
Then use those figures to work out historic relationships between income, costs, funding etc. Use those to create some working assumptions...and mine are fairly optimistic, 15% income growth pa and no major CAPEX investment for at least 5 years
On the basis of the assumptions project future growth of income, costs and perhaps most importantly cash.
Under a DCF model, the value of the club/company is the total cash estimated to be generated in future years, taking into account we would rather have £1 today than in a year or two year's time.
Calculate what is known as a 'terminal value, which is the estimate of cash from 2028 onwards by using a bit of financial maths and assuming that investors want (a fairly low) 8% return on their investment. This values the whole business as £2.9bn.
Give the banks back what is owed to them first, and this means the shares come out at a figure of $17.35 a share...and the Glazers want about $30. Only reason to pay it is if there are cash flows that no one has at yet unlocked, so can understand why QSI might walk away
Difficult to see why anyone would think that #MUFC is worth 20x what PIF paid for #NUFC from Mike Ashley. Not disputing that Manchester United has a bigger global fanbase, but turning that into cash is the challenge.
• • •
Missing some Tweet in this thread? You can try to
force a refresh
A history of Premier League transfer spending. First season (1992/93) total spend was £65m and QPR spent just £197k. Newly promoted Blackburn were the biggest spenders due to Jack Walker's investment in the likes of Alan Shearer, Stuart Ripley, Kevin Gallagher & Graham Le Saux.
1993/94 spending up to £78m. Blackburn continue to be the biggest spenders, Champions Manchester United were outspent by...err...Swindon.
First £100m spend season, Everton became the first team to eight figures spent in a season with Ferguson, Samways, Amokachi and Barrett all joining the club on big deals. QPR again smallest spenders. Man City and Chelsea outspent by Wimbledon.
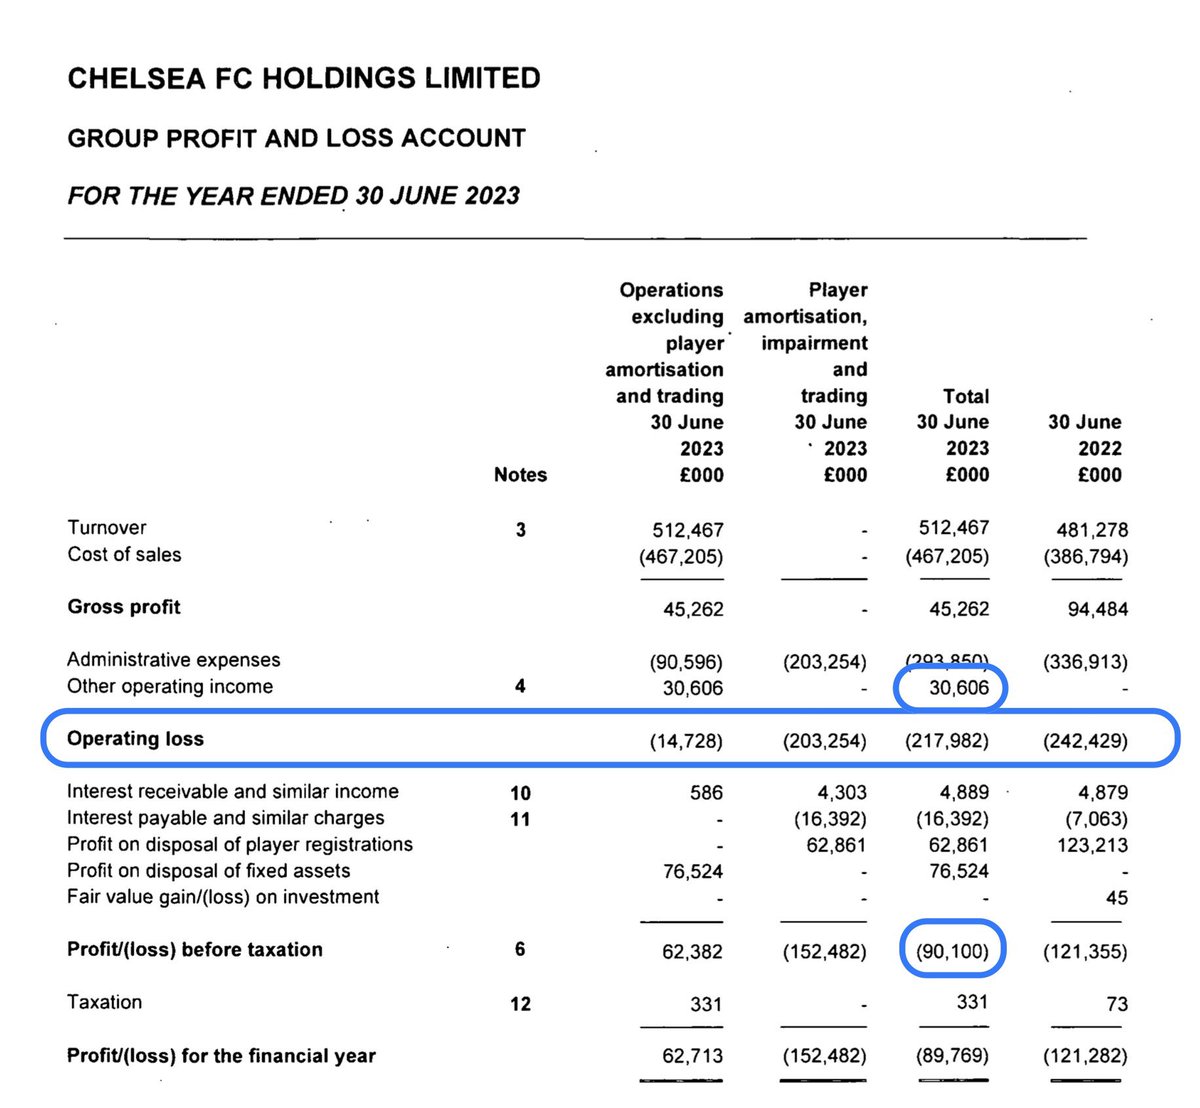
Chelsea FC Holdings submit 22/23 accounts. 🔑 figs
⚽️Revenue £512m ⬆️ 6%
⚽️Wages £404m ⬆️ 18%
⚽️Player costs (wages & amortisation) £119 for every £100 of revenue
⚽️Day to day losses £249m
⚽️Player purchases £745m
⚽️Player sales £203m
⚽️Borrowings in year £428m
Losses ⬆️ from £242m to £249m for day to day running of club but sale of hotel to another part of group, £30m of financial settlements & player sales ⬇️ this to £90m
Chelsea have cash in bank, total losses adding all the years together now £1.135 billion
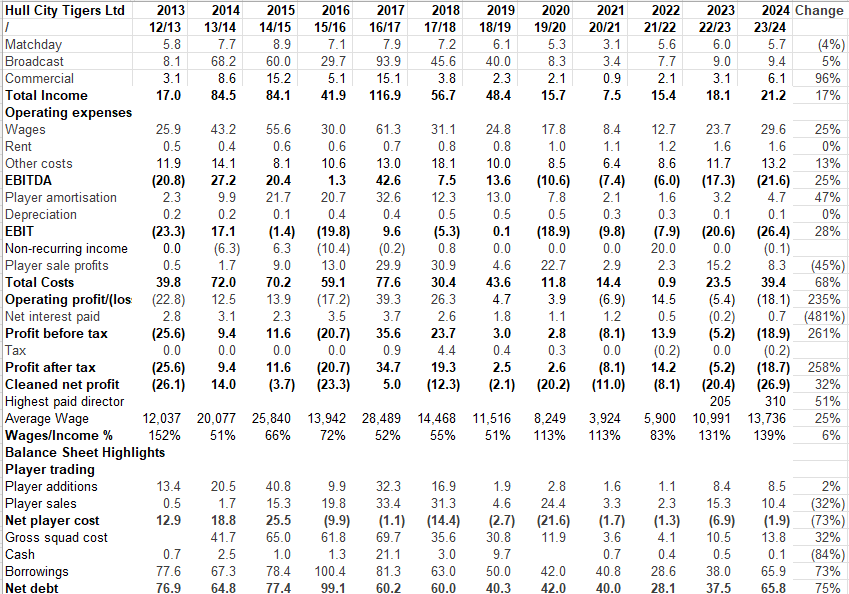
Whilst #Rovers 🔑 revenue streams, matchday, broadcast & commercial all ⬆️ significantly. However general overheads ⬆️ too which meant no change to op losses. Sale of Armstrong in 21/22 halved losses
Both accounts & audit report reference that there is a material uncertainty over ability of club to trade as a going concern. Should no noted that audit report dated December 2023 & things may have improved since then
Burnley publish 22/23 accounts; 🔑 figs
Revenue £65m ⬇️ 47%
Wages £54m ⬇️ 42%
Loss pre player sales £41m
Player purchases £84m
Player sales £21m
Borrowings £101m
Big change in pre tax profit of £36m in 21/22 to a loss of £36m in 22/23. Mainly due to ⬇️ in revenue following relegation and player sale profits ⬇️ from £54m to £11m.
Burnley still have substantial cash but this due to the Club borrowing substantial amounts during the year as liabilities ⬆️. Burnley still profitable over the years.
Leicester announce 22/23 accounts for 13 months to 30 June. 🔑 figs
Revenue £177m ⬇️ 17%
Wages £206m ⬆️ 13%
Loss pre player sales £152m ⬆️ 91%
Player sale profits £75m
Player purchases £53m
Player sales £104m
Extending financial year from 31 May to 30 June allowed Leicester to squeeze in sales of Maddison but pre tax loss (start point for PSR) still £90m.
Leicester total losses over the years now £295m. Liabilities ⬇️ after owner converted loans into shares.
Everton publish 22/23 accounts: 🔑 figs
Revenue £172m ⬇️ 5%
Wages £159m ⬇️ 2%
Amortisation £77m ⬆️ 23%
Manager/coaching payoff £7m
Executive payoff £2.5m
Loss pre player sales £130m
Pre tax loss £89m
Player signings £91m
Player sales £61m
Borrowings £341m
Losses ⬆️ due to no longer having Usmanov sponsor deals, wage ⬇️ modest & interest costs doubling
Cash balance down as club dealing with significant monthly demands in terms of meeting payroll and new stadium costs. Total losses over the years now £550m