
🧵Monthly economic review, with data through February. Biden continues setting one economic record after another, despite the Fed's best efforts to slow the #BidenBoom. 1/ 
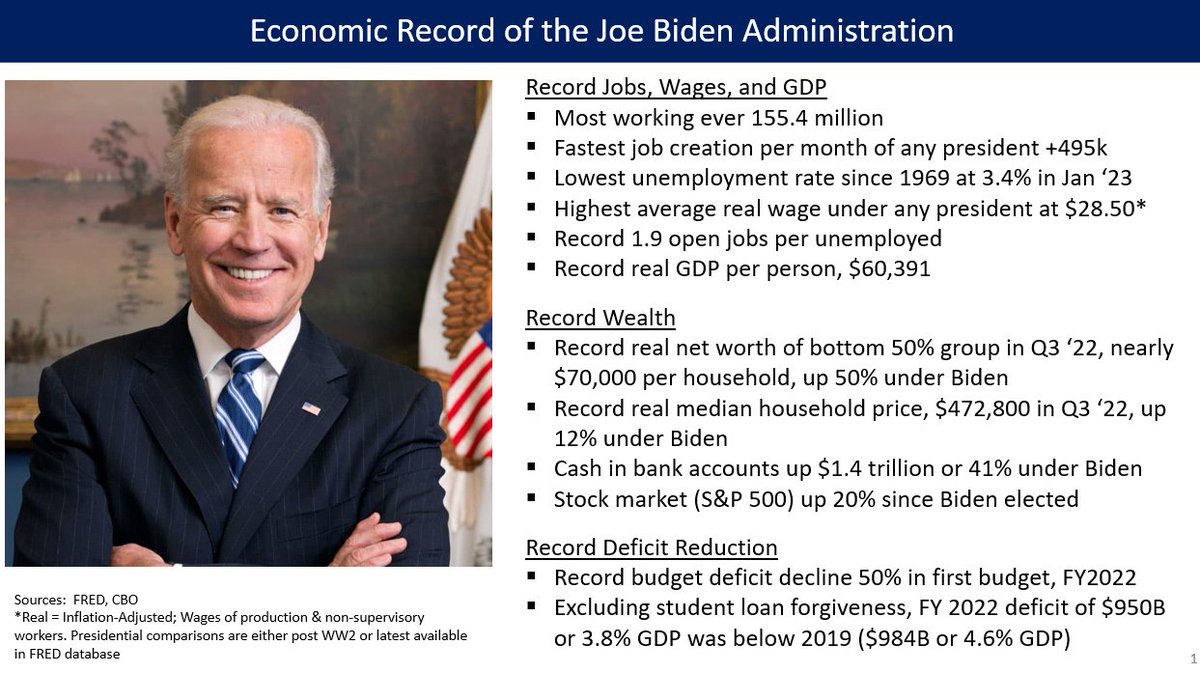
On most key measures adjusted for inflation, we're in better economic shape now than 2019 pre-pandemic. The unemployment rate hit 3.4% in Jan, lowest since '69, then popped back up to the 15 month average 3.6%. Jobs level, real GDP per capita, real net worth...all better. 2/

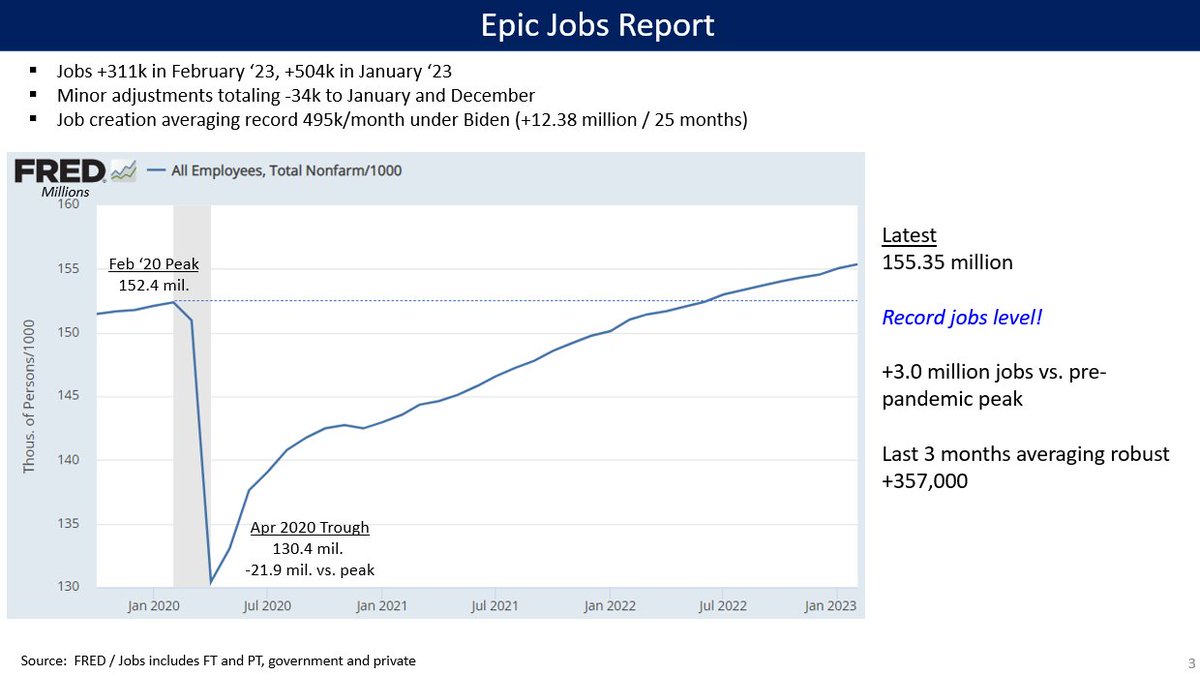
Perhaps the most important economic measure is jobs from the Establishment Survey:
✅+3.0 million above the pre-pandemic peak.
✅+12.4 million since 1/21
✅+495k avg Biden job creation / month; president with most job creation total is Clinton, who averaged 239k / month. 3/
✅+3.0 million above the pre-pandemic peak.
✅+12.4 million since 1/21
✅+495k avg Biden job creation / month; president with most job creation total is Clinton, who averaged 239k / month. 3/
Wage for production & non-supervisory workers have outgrown inflation if the starting point is pre-pandemic.
Yes, you have higher real wages (more purchasing power) now than in the vaunted 2019 economy, despite inflation! 4/
Yes, you have higher real wages (more purchasing power) now than in the vaunted 2019 economy, despite inflation! 4/

In fact, President Biden has the highest average real wages (2022$) of any president LBJ to present.
Note also that Carter had real wages nearly $2/hour higher than Reagan, despite the criticism he faced about inflation. 5/
Note also that Carter had real wages nearly $2/hour higher than Reagan, despite the criticism he faced about inflation. 5/

One of the reasons we have inflation is because consumers have so much money to spend. This is a combination of stimulus checks, child tax credit, big wage gains, and not spending on services 2020-2021. Middle 20% has about $10,000 more saved than pre-pandemic trend. 6/

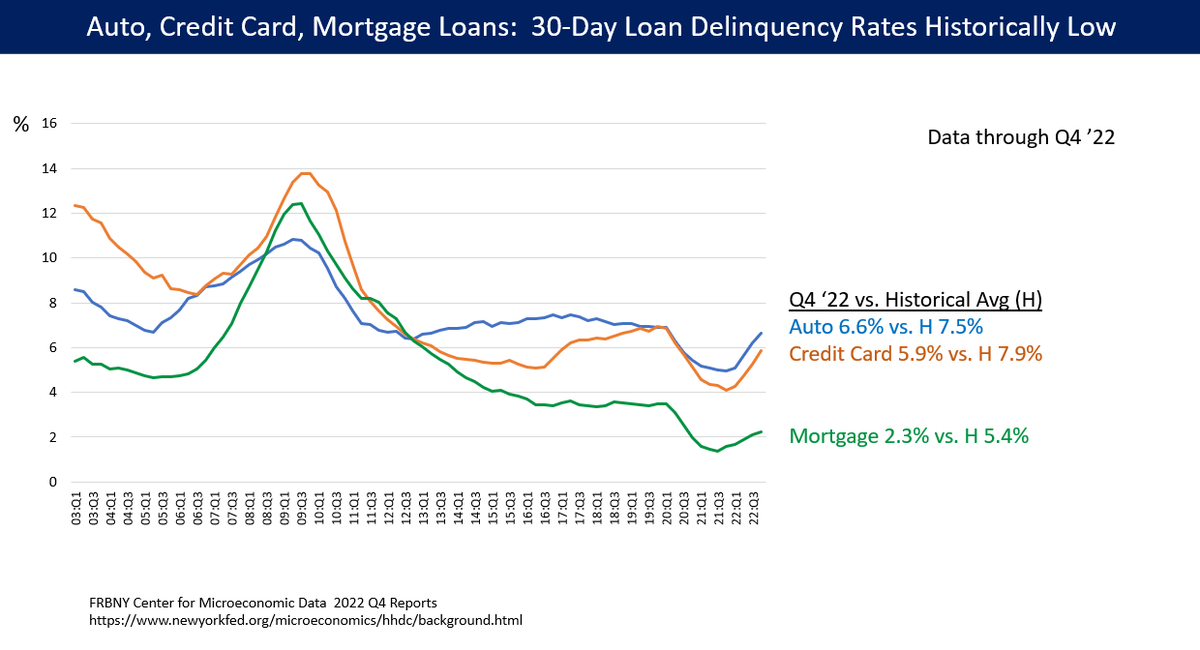
While we're seeing news reports about the amount of debt consumers are taking on, delinquencies on auto, credit card, and mortgages remain historically low, although they have risen recently. 7/
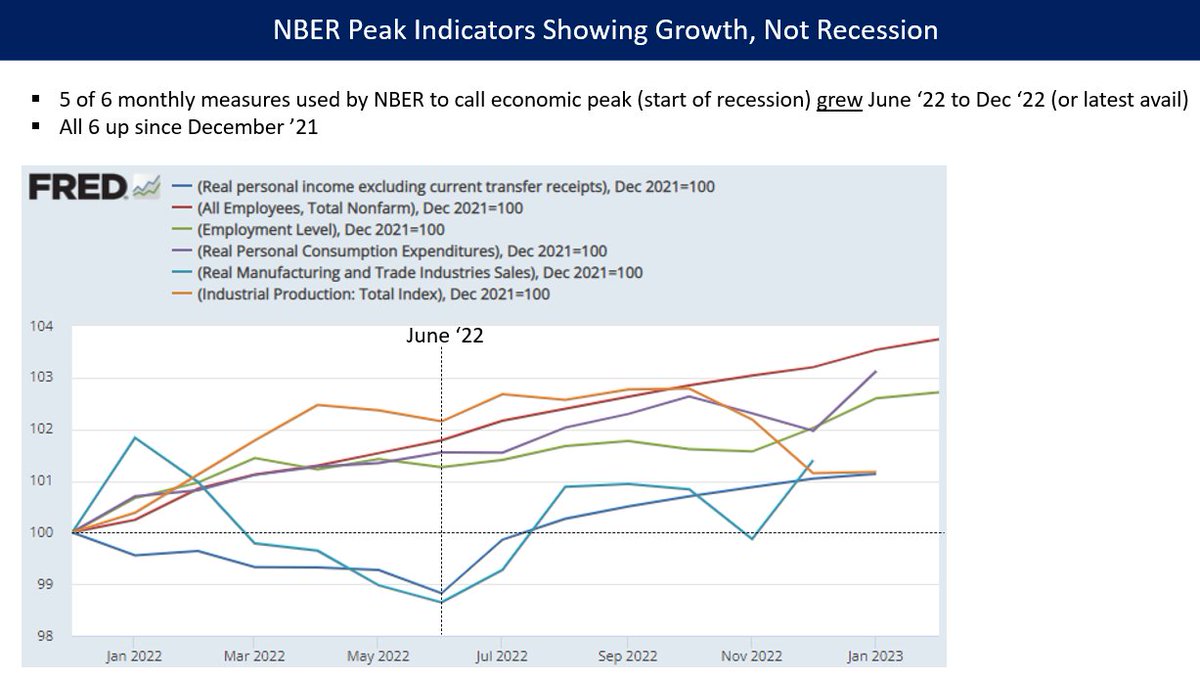
NBER is the organization that calls economic peaks / recession starts. However, 5 of the 6 key measures they use are up since June '22, and all 6 are up six December '21. These indicate growth, not recession. 8/
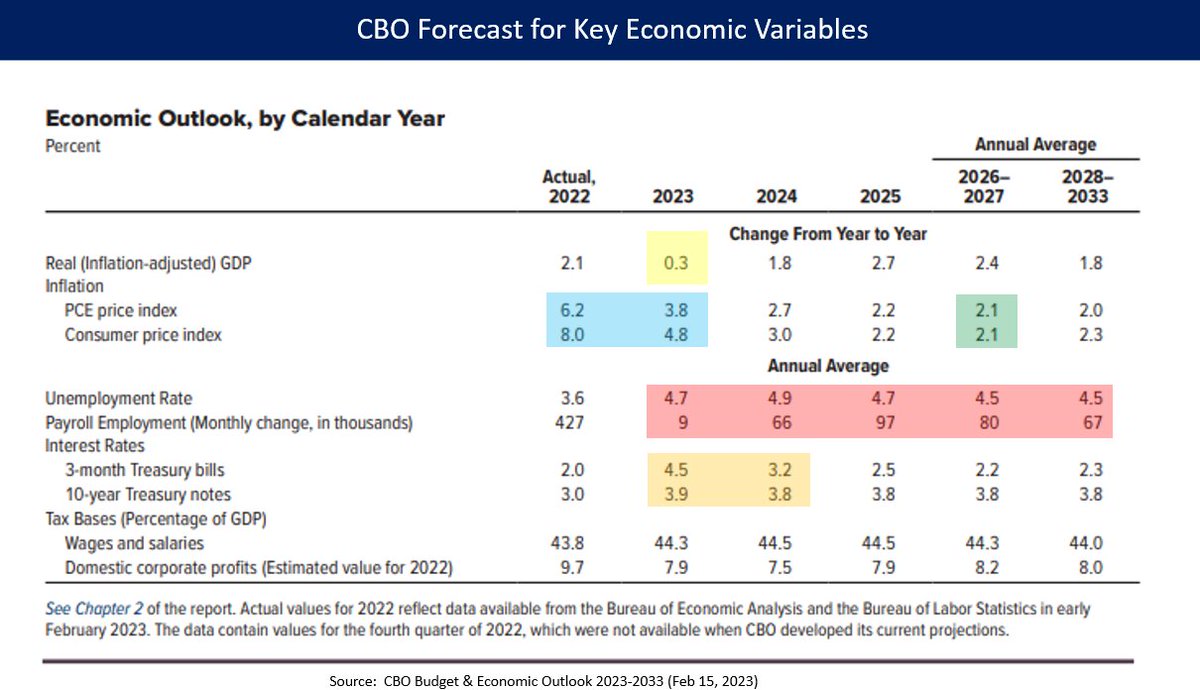
CBO released the annual "Budget and Economic Outlook" -- always fascinating to econ nerds.
CBO forecasting a recession in 2023, with near-zero growth, higher unemployment, and slowing inflation.
I think '23 will look more like '22 than forecast. 9/
CBO forecasting a recession in 2023, with near-zero growth, higher unemployment, and slowing inflation.
I think '23 will look more like '22 than forecast. 9/
The long-term budget situation is simply that expenses (outlays) grow faster than revenue as % GDP. Outlays increase driven by aging, healthcare inflation > GDP growth, and higher interest on debt. 10/

However, it's easy to argue we have a revenue problem not a spending problem.
Tax expenditures (discounts vs. table rates) are forecast at a whopping 7.4% GDP in 2023; top 20% get half that.
Budget deficit in 2022 was 5.5% GDP, or 3.8% GDP ex student loan forgiveness. 11/
Tax expenditures (discounts vs. table rates) are forecast at a whopping 7.4% GDP in 2023; top 20% get half that.
Budget deficit in 2022 was 5.5% GDP, or 3.8% GDP ex student loan forgiveness. 11/

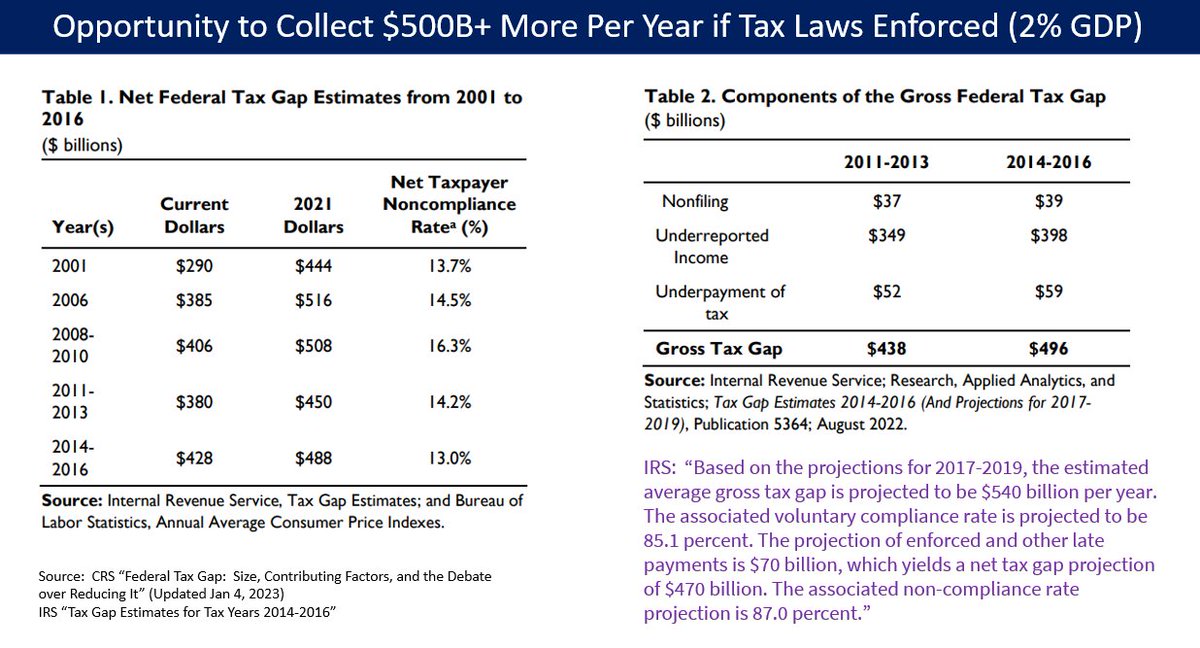
Yes, we have a big revenue problem here: IRS estimates tax cheats cost Treasury about 2% GDP per year or around $500 billion, mainly from the rich. The IRA invests in IRS to help collect this money from rich deadbeats; Republicans crying foul. 12/
The Social Security shortfall (revenue < outlays) for next 75 years is about 1.7% GDP on average.
For scale:
7.4% GDP tax expenditures
2.0% GDP tax collection opportunity
2.0% GDP Trump tax cut reversal
1.1% GDP Removing cap on payroll tax. 13/
For scale:
7.4% GDP tax expenditures
2.0% GDP tax collection opportunity
2.0% GDP Trump tax cut reversal
1.1% GDP Removing cap on payroll tax. 13/

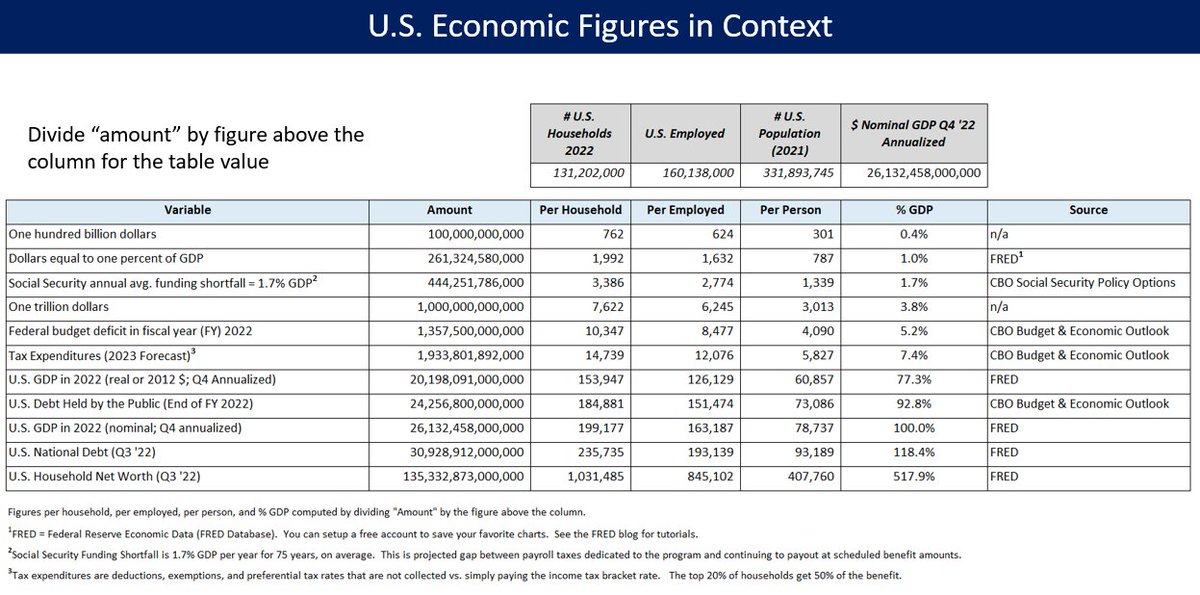
This table helps translate the gigantic economic and budgetary by displaying per household, % GDP, etc.
Callouts:
$135T household net worth; $5T of that belongs to bottom 50%.
----vs.-----
$30T national debt
Yes, plenty of money at the top to solve deficit "problem." 14/END
Callouts:
$135T household net worth; $5T of that belongs to bottom 50%.
----vs.-----
$30T national debt
Yes, plenty of money at the top to solve deficit "problem." 14/END
• • •
Missing some Tweet in this thread? You can try to
force a refresh


