1/5 After 10 months of decline and for the 3rd month in a row, our #US housing activity indicator has stopped deteriorating with 11 out of 15 indicators up, among which building permits
2/5 
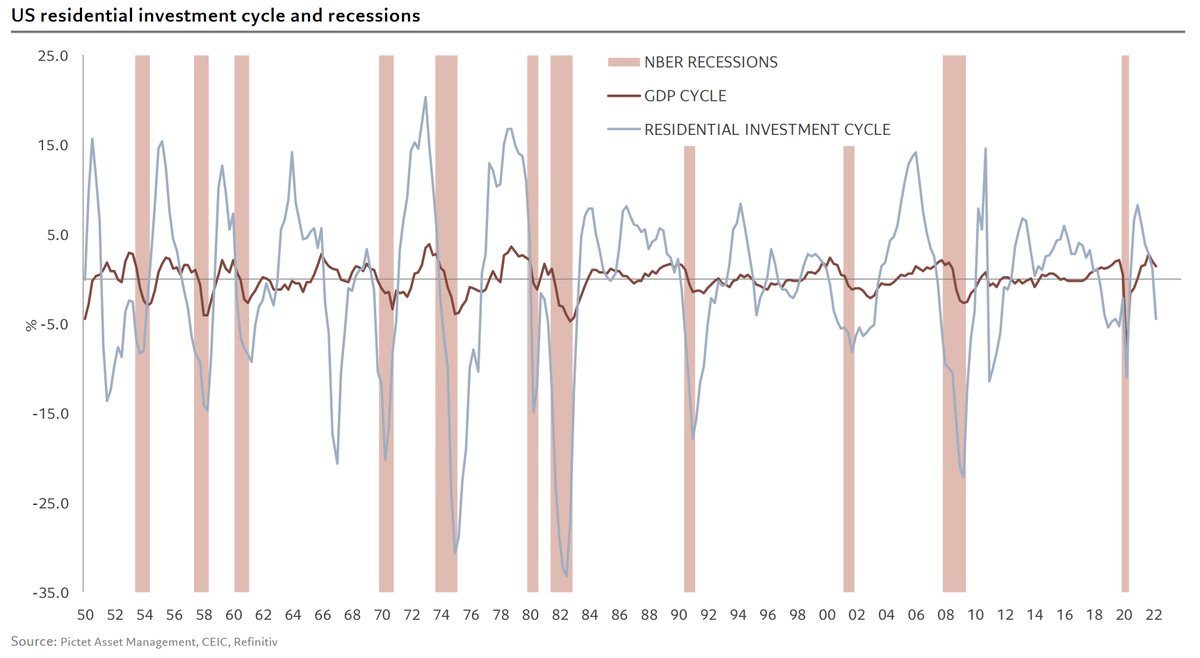
Housing was the 1st demand component to turn around in March 2021 and should, as in past cycles, be the first to recover
There are three main reasons for the first signs of recovery in the housing market:
3/5
1) The decline in house prices, which is expected to continue given the historical lag of prices on housing activity. This correction makes homes more affordable as is evident in the decline in the ratio of house prices to disposable income by over 10%
4/5 
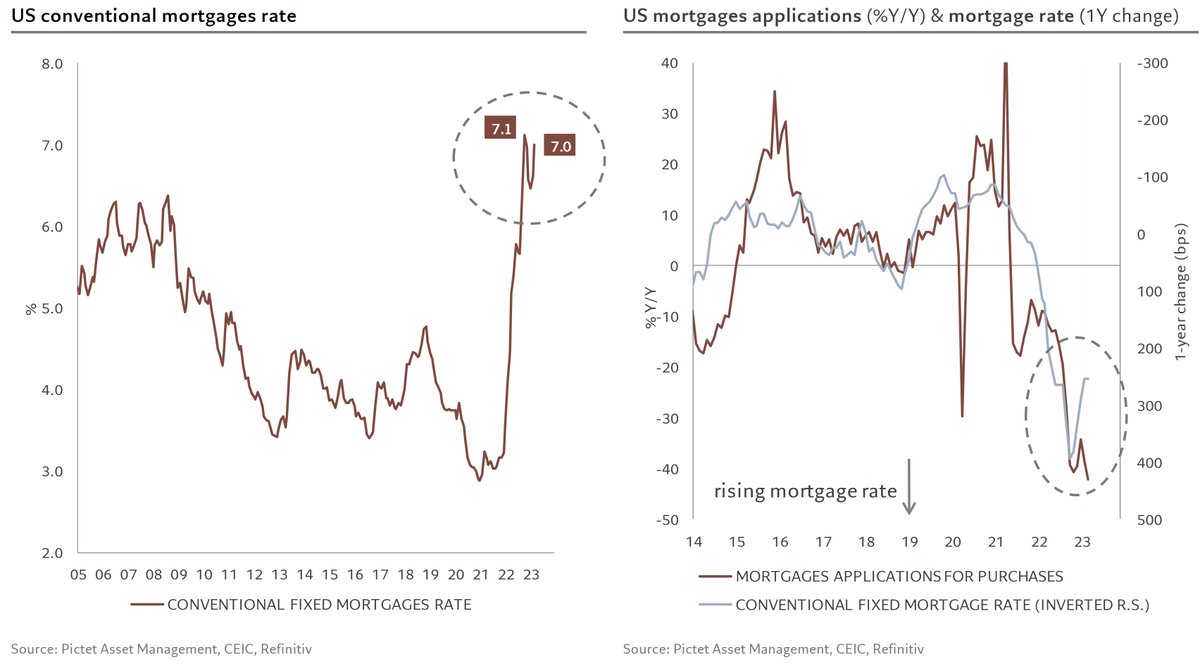
2) A stabilization of mortgage rates at their record levels of last October. While still high, this stabilization does put a floor under mortgage applications
5/5 
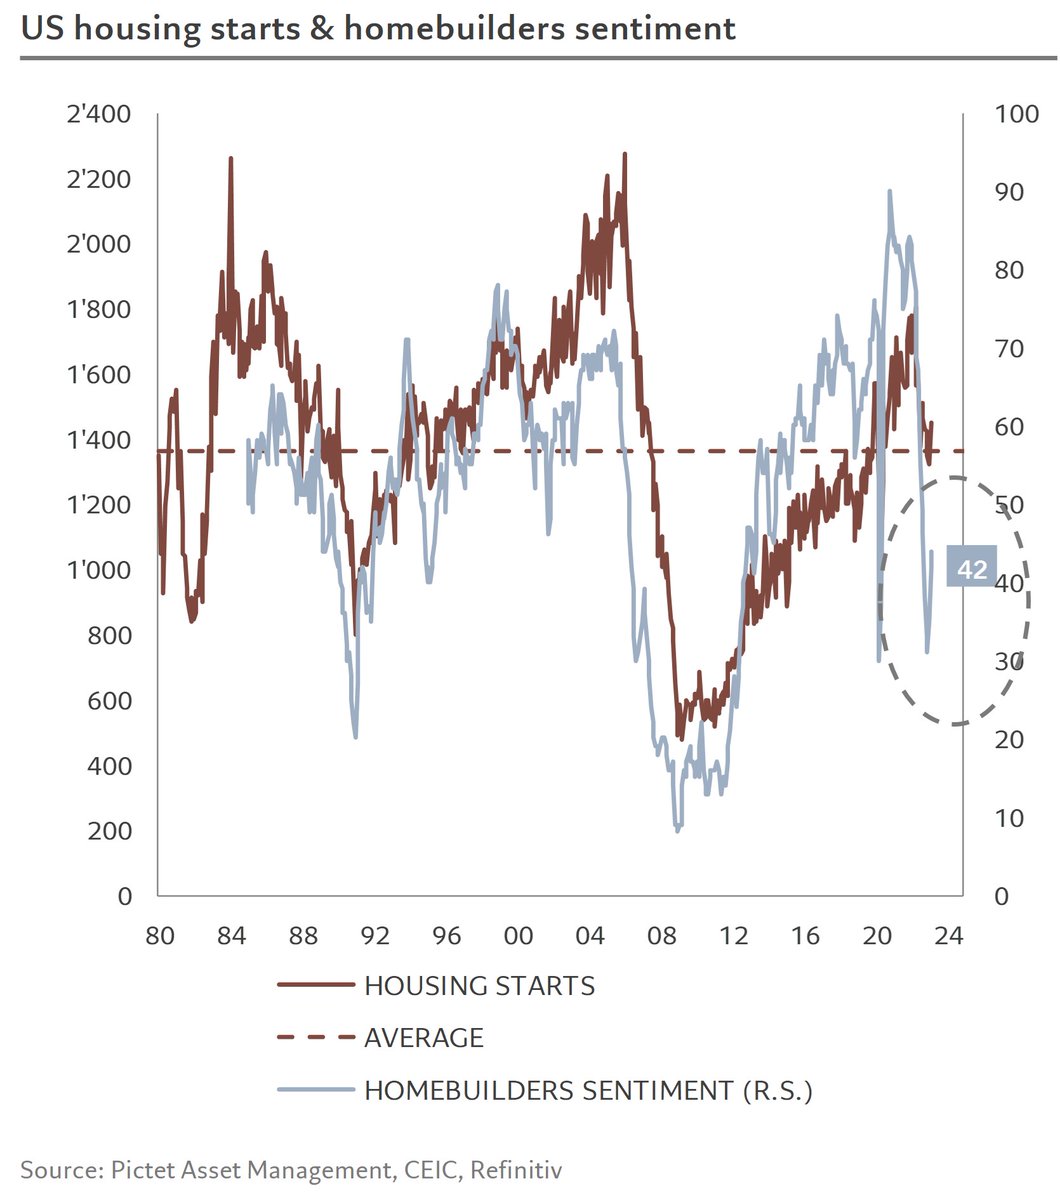
3) A rebound in homebuilders’ sentiment from its low in Dec 2022
• • •
Missing some Tweet in this thread? You can try to
force a refresh
1/ US core #inflation came out in line with expectations, down to 3.6% y/y from 3.8%
The decline stems from the continued contraction in goods prices to -1.2% y/y from -0.7%, while services inflation is unchanged at 5.3%.
2/ The fall in the price of goods is justified by demand, since retail sales in volume have been declining for 3 years, falling by an annualized 0.7% since the Nov 2021 peak
3/ Stable inflation at 5.3% is due partly to the continuing fall in rental inflation and partly to the continuing rise in inflation in the non-rent component, which on a 6-month annualized basis stands at 6.5% ... still worrying for the Fed
1/ The latest US activity and inflation data send a stagflationary signal, with GDP slowing to 1.6% q/q ann. from 3.4% in Q4 and slightly below potential for the 1st time in 18 months, and core inflation rising to 3.7% from 2%.
Where do we really stand in the US business cycle?
2/ A more detailed look at GDP gives a more nuanced picture
The decline in growth is indeed largely due to a sharp rise in imports, thus maintaining strong growth in domestic demand at 2.8% q/q ann. in line with the pre-pandemic 6Y average, but decelerating since Q4 (3.5%)
3/ Domestic demand remains underpinned by private demand (consumption + investment) and, in Q1 in particular, by a strong rebound in residential investment from very low levels
1/ In February, US household disposable income contracted in real terms, and is now 3.7% below its pre-pandemic trend, but above all is growing at a rate (1.3% 6m ann.) 2 times slower than its long-term trend...
2/ ... and households can no longer count on the excess savings accumulated during the pandemic, which should be fully spent by the end of April...
3/ ... nor can they compensate by increasing credit, which is growing at a rate well below its long-term average, affected by high interest rates...
1/ Chinese activity data for the first 2 months of the year were better than expected, starting with industrial production, which continues to grow above its pre-pandemic trend at an annualized rate of over 8% over 3 months
2/ Retail sales volume growth continued to improve gradually, at a rate of 7.7% 3m/3m ann., returning to the average rate seen in the 6 years prior to the pandemic
3/ Fixed investment remains largely driven by the manufacturing sector, while residential investment is down by over 15% y/y...
1/ After a strong rebound in January, the world manufacturing PMI corrected in February, with an uneninspiring movement in the components as activity fell at the margin while inflationary pressure on goods increased
2/ The activity component of the global PMI fell marginally by 0.2pt, but with a wide dispersion by region, with the advanced countries losing 1pt and Latin America gaining more than 2. In terms of levels, EM Asia ex-China remains comfortably in the lead at 54.9
3/ With the decline in developed countries and the rise in emerging markets, the gap in manufacturing activity between the 2 regions is once again close to its highest levels since the pandemic and GFC, which has generally benefited EM equity markets
1/ Chinese activity data for December shows that GDP ends the year slightly below (1.6%) its pre-pandemic trend, while GDP growth (4.9% q/q annualized with our own seasonal adjustment) is back to its potential
2/ Growth is back to potential, but the image of the Chinese economy remains unchanged. The property market still shows no signs of recovery on the supply side, and has deteriorated further on the demand side, which is now at its lowest level since mid-2009
3/ As a result, the stock of unsold homes has climbed to an all-time high, reaching more than 25 months at current sales rates. Pressure on house prices (down 0.9% y/y in Dec) is set to continue