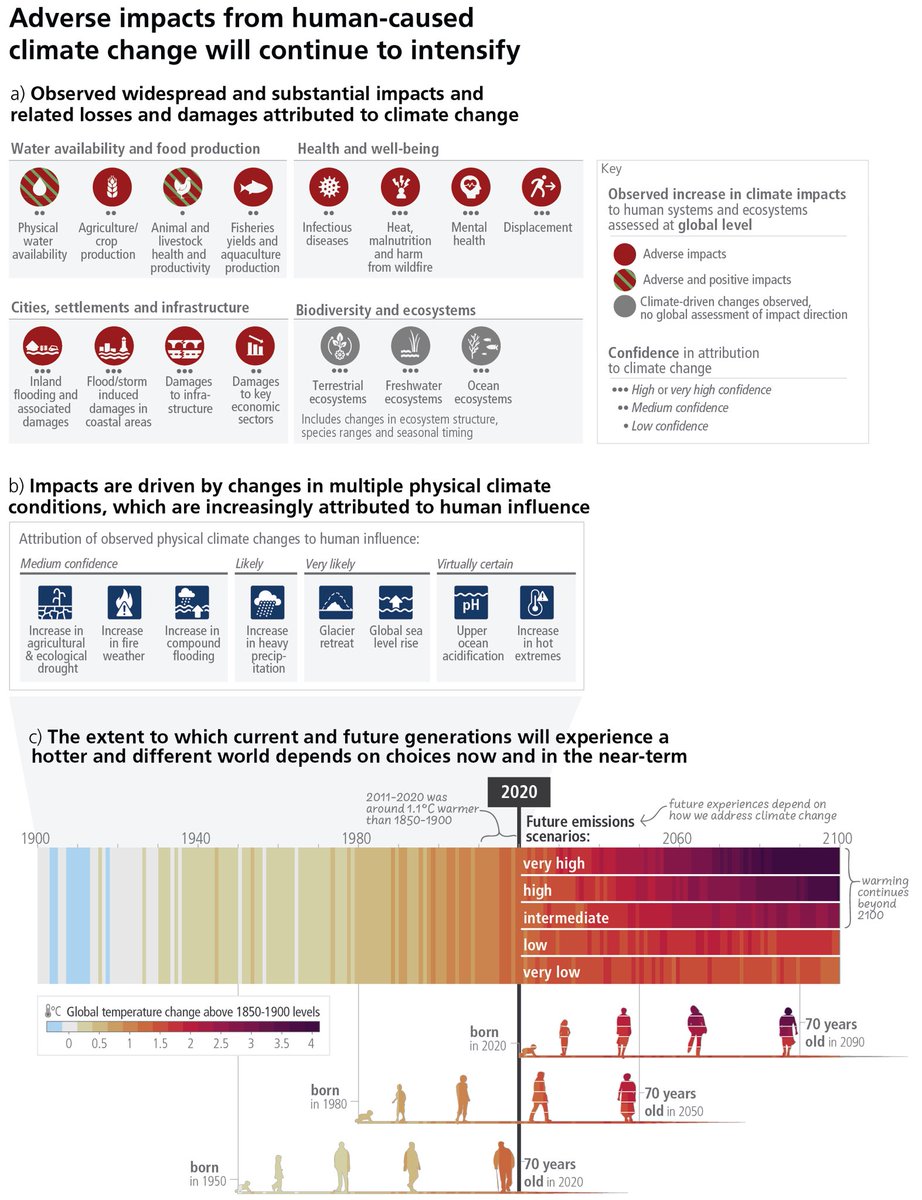
#IPCC SYR Figure SPM.3 shows how projected impacts indicate rising pressures on ecosystems, human health, crops and fisheries with higher global warming. These projections are without additional adaptation, but underscore the urgency of prevention and preparation. @IPCC_CH 1/5 

These examples are some of the multiple lines of evidence used in more comprehensive underlying assessments within WGII chapters on land and ocean ecosystems, health and food. Those chapters also provide info on adaptation options. 2/5
Thanks to William Cheung for leading on this figure, and figure team members @christrisos, @gueladiocisse, and Meeyoung Ha
Maize projections are shown as example of food system challenges. Even with carbon dioxide enhancements for growth and water retention, maize yields decline as plants respond to heat and drought. 4/5
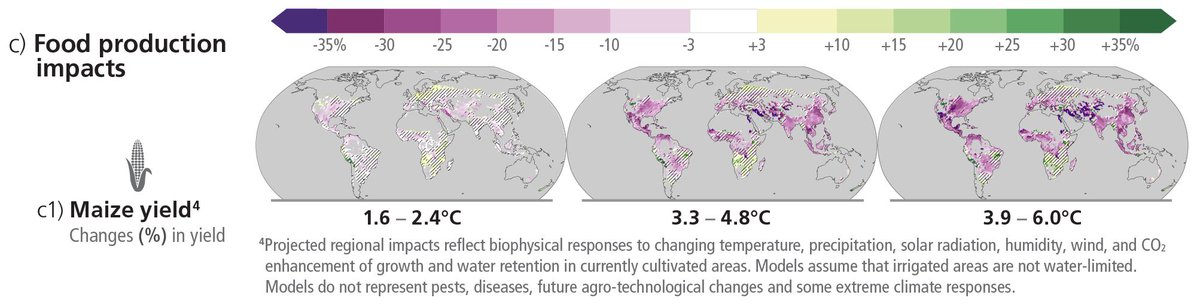
Maize maps drawn from collaborative @AgMIPnews / @ISIMIPImpacts study led by @JonasJaegermeyr using results from 12 crop models each driven by 5 climate models. Continued work needed to address vulnerability across diverse food system. 5/5
Full figures now available with SYR report here. ipcc.ch/report/ar6/syr…
• • •
Missing some Tweet in this thread? You can try to
force a refresh