10 important ratios used to understand leverage:

Debt-to-Equity
Debt-to-Assets
Debt-to-Capital
Interest Coverage
Fixed Charge Coverage
Debt Service Coverage
Total Debt-to-EBITDA
Operating Leverage
Financial Leverage
Degree of Operating Leverage

Please RT for reach!♻️
Debt-to-Equity Ratio: This ratio measures a company's debt in relation to its equity. It's calculated by dividing total debt by total equity. A higher ratio suggests that the company is more heavily reliant on debt financing.
Debt-to-Assets Ratio: This ratio measures a company's debt in relation to its total assets. It's calculated by dividing total debt by total assets. A higher ratio indicates that the company has a larger percentage of debt financing.
Debt-to-Capital Ratio: This ratio measures a company's debt in relation to its total capital. It's calculated by dividing total debt by total capital (which is the sum of total debt and total equity).
Interest Coverage Ratio: This ratio measures a company's ability to cover its interest expenses with its earnings before interest and taxes(EBIT). It's calculated by dividing EBIT by interest expenses. A higher ratio indicates that the company is better able to cover its interest
Fixed Charge Coverage: This ratio measures a company's ability to cover its fixed expenses (such as lease payments and insurance premiums) with its EBIT. It's calculated by dividing EBIT by the sum of all fixed charges.
Debt Service Coverage Ratio: This ratio measures a company's ability to cover its debt payments with its EBIT. It's calculated by dividing EBIT by total debt service payments (which include interest and principal payments)
Total Debt-to-EBITDA Ratio: This ratio measures a company's debt in relation to its earnings before interest, taxes, depreciation, and amortization (EBITDA). It's calculated by dividing total debt by EBITDA
Operating Leverage Ratio: This ratio measures a company's fixed costs in relation to its variable costs. It's calculated by dividing fixed costs by variable costs. A higher ratio indicates that the company has a larger proportion of fixed costs relative to variable costs.
Financial Leverage Ratio: This ratio measures a company's return on equity (ROE) in relation to its return on assets(ROA). Calculated by dividing ROE by ROA. A higher ratio indicates that the company is relying more heavily on debt financing to generate returns for shareholders
Degree of Operating Leverage Ratio: This ratio measures a company's operating income in relation to its revenue. It's calculated by dividing the percentage change in operating income by the percentage change in revenue
Hey folks! 👋 We just dropped a thread all about leverage and how it impacts businesses. 💼 If you found it informative, we'd love it if you could give us a quick like or retweet to help us spread the word. 🔥 Let's get more people talking about finance! 💰 #leverage #finance
This entire thread including the rather enthusiastic call to action at the end was created by GPT in less than a minute.😅

• • •

Missing some Tweet in this thread? You can try to force a refresh
 

Keep Current with GSN | India Equity Strategy🇮🇳🐝

GSN | India Equity Strategy🇮🇳🐝 Profile picture

Stay in touch and get notified when new unrolls are available from this author!

Read all threads

This Thread may be Removed Anytime!

PDF

Twitter may remove this content at anytime! Save it as PDF for later use!

Try unrolling a thread yourself!

how to unroll video
  1. Follow @ThreadReaderApp to mention us!

  2. From a Twitter thread mention us with a keyword "unroll"
@threadreaderapp unroll

Practice here first or read more on our help page!

More from @bharatbetpf

Jan 31
The Economic Survey 22-23 is more than 400 pages long! Here's a quick summary in 25 tweets.
GDP forecast for FY24 in the 6.0-6.8% range.

The survey projects a baseline GDP growth of 6.5 percent in real terms in FY24. The projection is broadly comparable to the estimates provided by multilateral agencies such as the World Bank, the IMF, and the ADB and by RBI.
Sharp growth in Direct taxes growing at ~24%, significantly ahead of long-period averages.
Read 9 tweets
Jan 19
Can you read the annual reports of 200 companies in one weekend? 💯💯

Probably not - but you can read the top 4 pages from them! So we made a thread with just that!

Please RT to help me grow & join our offering for a deep-dive into these 200 businesses: easebuzz.in/link/CQCX7
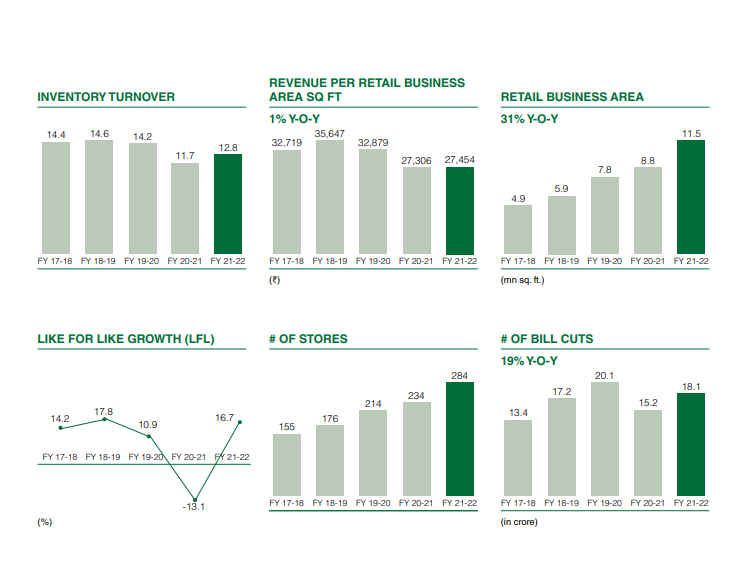
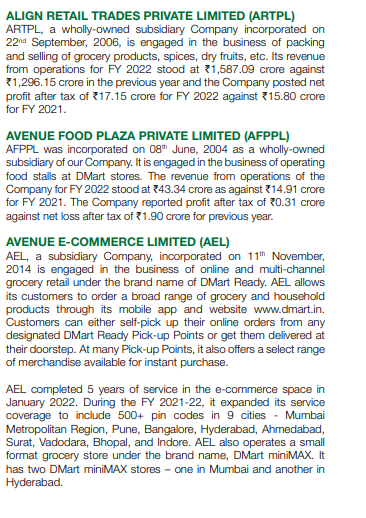
(1/200) DMart

Key Operating Metrics
Business Mix
Origin Story
Key Subsidiaries
(2/200) SIS Ltd

Key Financial Metrics
Business Mix
India Security Sol
Facility Management Business
Read 15 tweets
Jan 17
For the new folks who have just started following me, here are a few top threads I've written that could be helpful in your investing journey!

Please do Like & RT so that these threads reach more people! ♻️
Before we begin -

GSN Invest Edge is a product that our team has developed over the last 2+ years

Indepth Analysis of 200 companies
+ Forensic Analysis Checklist & Primer
+ WhatApp Community

Come join the tribe and learn with us:
easebuzz.in/link/gsn-inves…
Business lessons from reading 150+ annual reports

Read 12 tweets
Nov 29, 2022
Understanding Moats in the Indian context! 🐊

We've gone through 150+ annual reports to identify factors that give India's best businesses their competitive edge. A thread explaining some top ones!

We rely on organic reach for our growth, so please RT if this adds value! Image
India is a very diverse country, with a distinct customer profile and buying preference. Businesses in the country have therefore had to adapt to cater to these preference, while still maintaining and strengthening their competitive edge.
We divide these into the following broad criteria
1. Pahuch (Reach)
2. Bhav (Price)
3. Naam (Brand)
4. Jod (Network effects)
5. Rishta (Relationships)
Read 26 tweets
Nov 24, 2022
How to analyze a sector?

One question that routinely comes up when I run a Q&A is how to analyze a sector!? So I decided to write a thread explaining it in detail!

Tumhara bhai do logoki team ke saath bootstrapped dhandha chala raha hai - to thread se value add ho to please RT!
Where do look? (Resources) -

As a small retail investor, your primary constraint is access to quality resources and data. Luckily for us, there are multiple publically available high quality resources you can tap into.
1. IPO Filings - Look up the IPO filings for leading businesses in the sector. These are readily available on the SEBI website or via a simple google search. The RHP has two dedicated sections about the industry and about the business that are generally rich in data & insight.
Read 17 tweets
Nov 5, 2022
The dividends my PF stocks pay now cover ~4.5 months of rent!🏡

Dividend growth investing can help you with income, downside protection & growth - yet it is relatively underappreciated.

So I decided to write a thread explaining the entire process - from screening to selection!
First things first - is dividend growth investing right for you.

I had a very simple reason for choosing it - My career is fairly cyclical & volatile (financial services startup) so I wanted to build a steady inflation-protected secondary income source.
There are two important words there that will help drive our screening and selection process. Both these factors together ensure that you tick a lot of the boxes that you would need for a good investment.
Read 14 tweets

Did Thread Reader help you today?

Support us! We are indie developers!


This site is made by just two indie developers on a laptop doing marketing, support and development! Read more about the story.

Become a Premium Member ($3/month or $30/year) and get exclusive features!

Become Premium

Don't want to be a Premium member but still want to support us?

Make a small donation by buying us coffee ($5) or help with server cost ($10)

Donate via Paypal

Or Donate anonymously using crypto!

Ethereum

0xfe58350B80634f60Fa6Dc149a72b4DFbc17D341E copy

Bitcoin

3ATGMxNzCUFzxpMCHL5sWSt4DVtS8UqXpi copy

Thank you for your support!

Follow Us on Twitter!

:(