
🚨Our new study is out @CellReports!
We use single cell protein quantification & single cell FISH to map #spatial interactions in genetic mosaicism & tumor microenvironment in #Glioblastoma!
Wonderful collaboration w/ @janiszewska_lab @DalitEngelhardt
@Kacper_W_PhD
Deep dive👇
We use single cell protein quantification & single cell FISH to map #spatial interactions in genetic mosaicism & tumor microenvironment in #Glioblastoma!
Wonderful collaboration w/ @janiszewska_lab @DalitEngelhardt
@Kacper_W_PhD
Deep dive👇

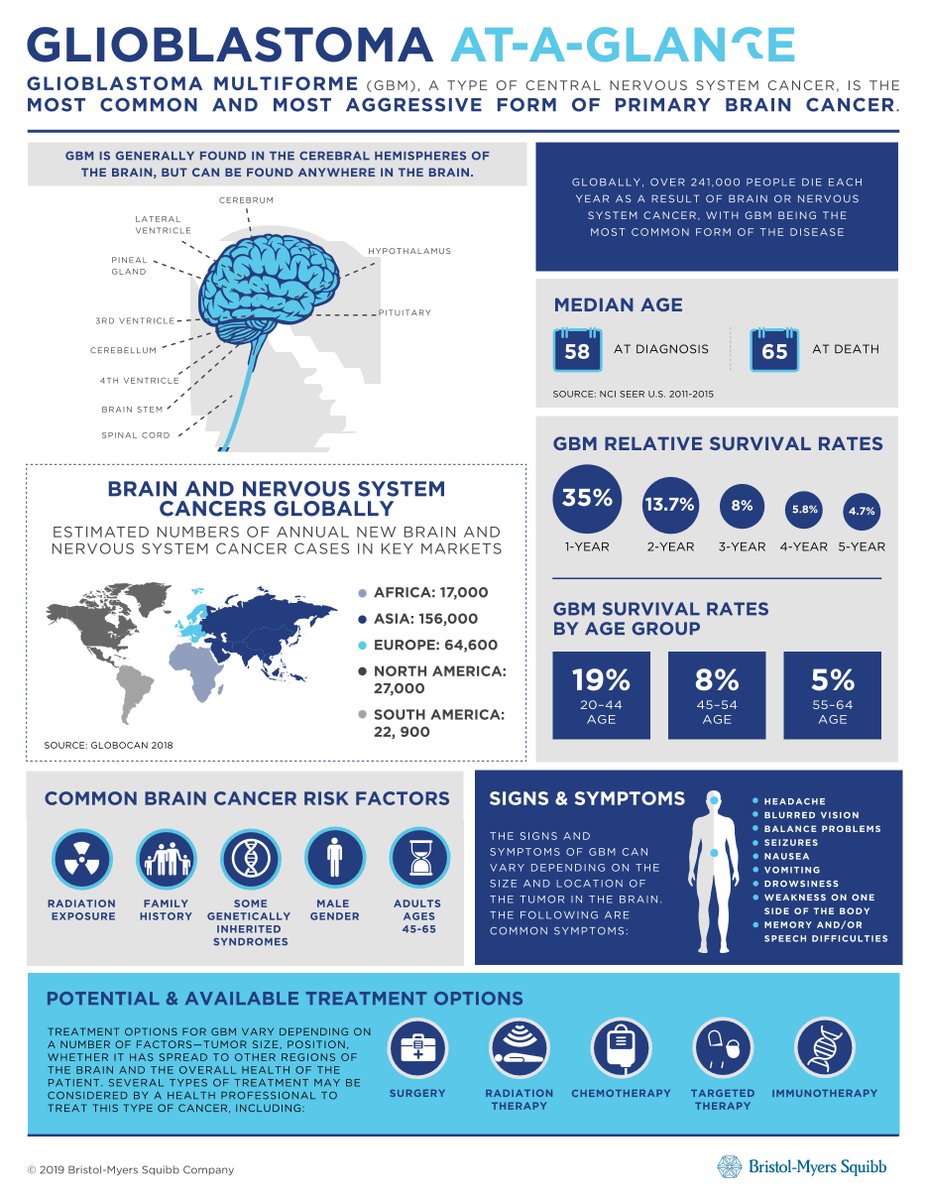
First, some context.
Glioblastoma (GBM) is one of the deadliest, most aggressive cancers that exist, with a median survival of only 15 months.
In GBM, 'single cell heterogeneity' are not simply buzzwords.
Rather, this immense heterogeneity is a main reason of treatment failure
Glioblastoma (GBM) is one of the deadliest, most aggressive cancers that exist, with a median survival of only 15 months.
In GBM, 'single cell heterogeneity' are not simply buzzwords.
Rather, this immense heterogeneity is a main reason of treatment failure
Recent work demonstrated that single GBM tumors are mosaics of cells in different states, each associated with distinct genomic driver alterations.
While transitions between cell states can occur, each genetic driver favors a particular cell state.
tinyurl.com/mrx2jpj8
While transitions between cell states can occur, each genetic driver favors a particular cell state.
tinyurl.com/mrx2jpj8
Here, we aimed to better understand how genetically different GBM populations *spatially* interact with each other & further with the tumor microenvironment
We studied this via highly multiplexed spatial protein profiling & single cell spatial mapping of FISH in selected drivers
We studied this via highly multiplexed spatial protein profiling & single cell spatial mapping of FISH in selected drivers
To do this, we constructed a tissue microarray (TMA) from 17 formalin-fixed paraffin-embedded (FFPE) IDH wild-type GBM tumors.
From each tumor block, we randomly selected 3–4 cores (61 in total) to investigate patterns of local intra-tumor heterogeneity within each tumor biopsy.
From each tumor block, we randomly selected 3–4 cores (61 in total) to investigate patterns of local intra-tumor heterogeneity within each tumor biopsy.

We used 3 slides of the multiregion TMA for single cell profiling of:
- EGFR, CDK4 & PDGFRA DNA by multicolor FISH (35K cells)
- specific-to-allele PCR-FISH (STAR-FISH, 26K cells)
- protein production, NanoString GeoMx digital spatial profiling (DSP, 79 proteins)
Main findings👇
- EGFR, CDK4 & PDGFRA DNA by multicolor FISH (35K cells)
- specific-to-allele PCR-FISH (STAR-FISH, 26K cells)
- protein production, NanoString GeoMx digital spatial profiling (DSP, 79 proteins)
Main findings👇

1. Local heterogeneity in GBM microenvironment (GeoMx DSP data)
DSP allows quantification of oligo tags released by UV-illuminated regions of interest (ROI) selected by immunofluorescent staining.
It enables simultaneous antibody staining for 10s of markers & control antibodies
DSP allows quantification of oligo tags released by UV-illuminated regions of interest (ROI) selected by immunofluorescent staining.
It enables simultaneous antibody staining for 10s of markers & control antibodies

Here, we selected 96 ROIs from the 61 TMA cores, with 2–3 ROIs in cores with heterogeneous immunofluorescent staining.
These ROIs were then subjected to DSP for 79 protein markers associated with GBM biology, neurobiology, and immunology.
These ROIs were then subjected to DSP for 79 protein markers associated with GBM biology, neurobiology, and immunology.
We observed interesting spatial patterns:
- protein levels of immune genes (CD68, HLA-DR, CD11b, CD45, IBA1, CD163, CD14) correlated across tumors
- members of the WNT pathway correlated with TCF/LEF pathway
- clusters of immune & neuronal markers were negatively correlated
- protein levels of immune genes (CD68, HLA-DR, CD11b, CD45, IBA1, CD163, CD14) correlated across tumors
- members of the WNT pathway correlated with TCF/LEF pathway
- clusters of immune & neuronal markers were negatively correlated

Since the TMA cores represent spatially distant regions of the same tumor fragment with possibly different compositions, we assessed the variability of protein production between ROIs from distinct tumors relative to the variability within tumors (Kruskal-Wallis H test).

The ratio of inter-to-intra tumor variability was quite different across the profiled proteins.
For example, vascular cell adhesion molecule (VCAM) & CD31, both associated with endothelial function & tumor vascularization, showed high variance between regions of the same tumor.
For example, vascular cell adhesion molecule (VCAM) & CD31, both associated with endothelial function & tumor vascularization, showed high variance between regions of the same tumor.
On the contrary, immune-related proteins s.a. CD45, as well as EGFR and p53 (often overexpressed & mutated in GBM), showed particularly high inter vs. intra-tumor variability
This may indicate that immune state & major drivers are less variable between biopsies in the same tumor
This may indicate that immune state & major drivers are less variable between biopsies in the same tumor
2. Single-cell genetic heterogeneity in GBM
We performed multiplexed FISH for EGFR & CDK4 on the multicore TMA (35K nuclei in 17 tumors).
We chose these 2 genes because their copy number amplifications characterize genetically distinct GBM states (+PDGFRA, but no signal here).
We performed multiplexed FISH for EGFR & CDK4 on the multicore TMA (35K nuclei in 17 tumors).
We chose these 2 genes because their copy number amplifications characterize genetically distinct GBM states (+PDGFRA, but no signal here).

Therefore, each cell was assigned to one of the following 4 genotypes:
- E (EGFR amplified & not CDK4 amplified)
- C (CDK4 amplified & not EGFR amplified)
- EC (EGFR & CDK4 amplified)
- N/O (no amplification of either EGFR or CDK4)
- E (EGFR amplified & not CDK4 amplified)
- C (CDK4 amplified & not EGFR amplified)
- EC (EGFR & CDK4 amplified)
- N/O (no amplification of either EGFR or CDK4)

We found variation in the frequency of cells of each genotype within each tumor.
Although many tumors had relatively high E cell frequency, C & EC cells were also present in most.
There was also variation between cores taken from the same biopsy, meaning within small regions.
Although many tumors had relatively high E cell frequency, C & EC cells were also present in most.
There was also variation between cores taken from the same biopsy, meaning within small regions.

The relative proportions of the different genotypes followed interesting correlation patterns (each point here represents the ratio of the cells with a particular genotype to the total number of cells within a tumor; beware the axes don't go all the way 0-1).

3. Tumor stratification by co-occurrence of EGFR & CDK4 in same vs. different cells
Our dataset of single cell genotypes allows investigating differences btwn tumors in which these alterations tend to co-occur in same cell & tumors in which they do not(different cells or absent)
Our dataset of single cell genotypes allows investigating differences btwn tumors in which these alterations tend to co-occur in same cell & tumors in which they do not(different cells or absent)
For this, we calculated the odds ratio (OR) of detecting co-amplified cells within each of the 17 GBMs.
The OR = the likelihood that a cell with EGFR amplification also harbors a CDK4 amplification, relative to the likelihood of a CDK4 amplification without EGFR amplification.
The OR = the likelihood that a cell with EGFR amplification also harbors a CDK4 amplification, relative to the likelihood of a CDK4 amplification without EGFR amplification.
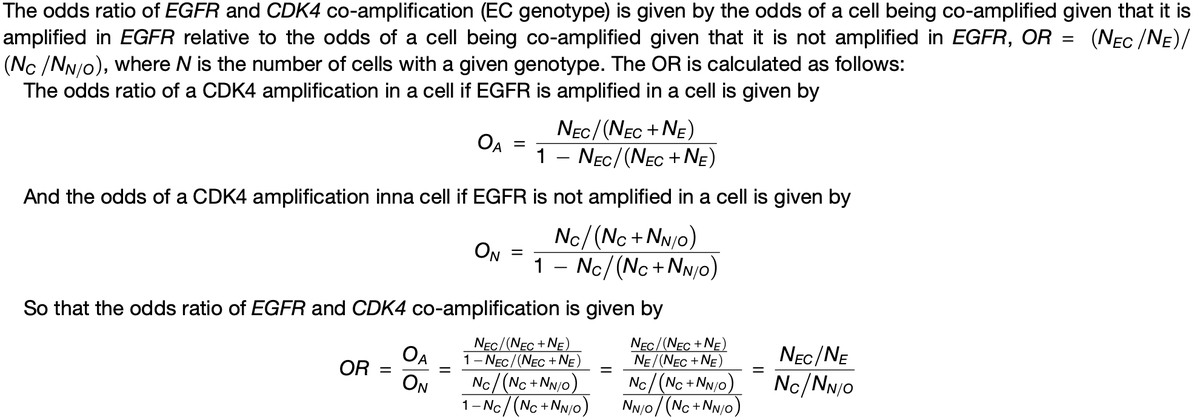
OR = 1: amplification in one of these 2 genes has no effect on the other being amplified.
OR above/below 1: increased/decreased tendency for EGFR & CDK4 amplifications to co-occur in same cell vs. what is expected if one amplification had no effect on the other one occurring.
OR above/below 1: increased/decreased tendency for EGFR & CDK4 amplifications to co-occur in same cell vs. what is expected if one amplification had no effect on the other one occurring.
Based on OR values, we separated tumors into 3 classes:
- ORlow: decreased tendency for EGFR & CDK4 same-cell co-amplification (OR <<1)
- ORhigh: increased tendency for EGFR & CDK4 same-cell co-amplification (OR >>1)
- no effect (OR ~ 1)
- ORlow: decreased tendency for EGFR & CDK4 same-cell co-amplification (OR <<1)
- ORhigh: increased tendency for EGFR & CDK4 same-cell co-amplification (OR >>1)
- no effect (OR ~ 1)

The frequencies of E cells (only EGFR amplification) & N/O cells (neither EGFR nor CDK4) were different between ORhigh & ORlow groups, while C & EC cells were similarly distributed
It can then be that low OR is driven by increased frequency of cells with only EGFR amplification
It can then be that low OR is driven by increased frequency of cells with only EGFR amplification

Both the average & the entropy of EGFR copy number values in E cells was significantly higher in ORlow tumors (unlike CDK4).
This suggests that it may be that EGFR amplifications in E cells in ORlow tumors are qualitatively different from those in E cells in ORhigh tumors.
This suggests that it may be that EGFR amplifications in E cells in ORlow tumors are qualitatively different from those in E cells in ORhigh tumors.

A possible explanation is that EGFR amplification is generated by extrachromosomal DNA (ecDNA) fragments in ORlow tumors.
ecDNA fragments contain an oncogene & an enhancer element, allowing for increased gene expression.
Their presence has been documented in GBM.
ecDNA fragments contain an oncogene & an enhancer element, allowing for increased gene expression.
Their presence has been documented in GBM.
We tested this by running AmpliconArchitect on whole genome seq. data from 3 ORlow & 3 ORhigh tumors.
ORlow tumors indeed showed a complex structure of genomic rearrangements involving EGFR amplicon, versus simpler amplification patterns in ORhigh tumors
nature.com/articles/s4146…
ORlow tumors indeed showed a complex structure of genomic rearrangements involving EGFR amplicon, versus simpler amplification patterns in ORhigh tumors
nature.com/articles/s4146…
Coming back:
The in situ single cell genotyping dataset that we generated contains spatial coordinates for each nucleus recorded in an image.
So, based on this data, we can compute distances between spatial locations of cells with distinct genotypes in ORlow & ORhigh tumors.
The in situ single cell genotyping dataset that we generated contains spatial coordinates for each nucleus recorded in an image.
So, based on this data, we can compute distances between spatial locations of cells with distinct genotypes in ORlow & ORhigh tumors.
Interestingly, we find that:
- E cells in ORlow tumors are closer to each other than ORhigh (same distance for C)
- C cells show a tendency towards tighter clustering in the tissue
This suggests that cells with only CDK4 amplif are less migratory & remain closer after division.
- E cells in ORlow tumors are closer to each other than ORhigh (same distance for C)
- C cells show a tendency towards tighter clustering in the tissue
This suggests that cells with only CDK4 amplif are less migratory & remain closer after division.

4. The co-occurrence of EGFR & CDK4 amplifications is associated with an immunosuppressive tumor microenvironment
ORhigh tumors were enriched in proteins associated with immune cell infiltration & an immunosuppressive microenvironment (CD163, IBA1, CD14, CD45, CD11b, HLA-DR).
ORhigh tumors were enriched in proteins associated with immune cell infiltration & an immunosuppressive microenvironment (CD163, IBA1, CD14, CD45, CD11b, HLA-DR).

Immunofluorescent staining of the original sections from ORlow & ORhigh tumors confirmed huge differences in infiltration of CD163+ cells.
Interestingly, this can suggest that a higher relative frequency of EGFR & CDK4 co-amplif. is associated w/ a more immunosuppressive state!
Interestingly, this can suggest that a higher relative frequency of EGFR & CDK4 co-amplif. is associated w/ a more immunosuppressive state!

Phew, that's it for this long thread!
TL;DR:
- EGFR-CDK4 co-amplification corresponds to distinct alteration and expression trends. This co-amplification is subclonal & can only be recovered from single-cell data (hidden in bulk)
TL;DR:
- EGFR-CDK4 co-amplification corresponds to distinct alteration and expression trends. This co-amplification is subclonal & can only be recovered from single-cell data (hidden in bulk)
- it is possible that our FISH data identified tumors harboring extrachromosomal DNA EGFR as a distinct class of tumors, associated with low immune marker expression & high levels of EGFR protein
- immune cells infiltrating ORhigh tumors may be predominantly immunosuppressive
- immune cells infiltrating ORhigh tumors may be predominantly immunosuppressive
- even though preliminary, this suggests that the assessment of co-amplification of EGFR and CDK4 at the single-cell level by FISH could serve as a proxy of immune status (much easier & reliable to assess than standard immunofluorescence for immune infiltration)
Finally, links for:
paper: tinyurl.com/2wsm454m
Github: tinyurl.com/mph5uxyk
Zenodo: tinyurl.com/ye275d9v
WGS data: tinyurl.com/esfep873
It was an immense pleasure to work together with
@janiszewska_lab & all coauthors on such an important project!
Thank you all 👏
paper: tinyurl.com/2wsm454m
Github: tinyurl.com/mph5uxyk
Zenodo: tinyurl.com/ye275d9v
WGS data: tinyurl.com/esfep873
It was an immense pleasure to work together with
@janiszewska_lab & all coauthors on such an important project!
Thank you all 👏
• • •
Missing some Tweet in this thread? You can try to
force a refresh


