Do you need to analyze Spatial Transcriptomics data, but are lost in the endless sea of methods?
Here's an explainer of the new @NatureComms paper benchmarking 18 spatial cellular deconvolution methods🧵🧵
nature.com/articles/s4146…
Here's an explainer of the new @NatureComms paper benchmarking 18 spatial cellular deconvolution methods🧵🧵
nature.com/articles/s4146…

This thread is organized as follows:
1️⃣ Intro to Spatial Transcriptomics
2️⃣ Intro to Cellular Deconvolution
3️⃣ Methods benchmarked
4️⃣ Datasets used (real & simulated)
5️⃣ Performance assessment
6️⃣ Benchmarking results
7️⃣ Accuracy
8️⃣ Robustness
9️⃣ Usability
🔟 Guidelines
1️⃣ Intro to Spatial Transcriptomics
2️⃣ Intro to Cellular Deconvolution
3️⃣ Methods benchmarked
4️⃣ Datasets used (real & simulated)
5️⃣ Performance assessment
6️⃣ Benchmarking results
7️⃣ Accuracy
8️⃣ Robustness
9️⃣ Usability
🔟 Guidelines
1️⃣ What is Spatial Transcriptomics & why is it important?
Spatial Transcriptomics (Method of the Year 2020) is a fast evolving field.
It holds great potential to further our understanding of development & disease, by placing cells in their spatial native tissue context.
Spatial Transcriptomics (Method of the Year 2020) is a fast evolving field.
It holds great potential to further our understanding of development & disease, by placing cells in their spatial native tissue context.
Spatial Transcriptomics technologies are of 2 types:
A. Image-based (in situ sequencing & in situ hybridization): profile mRNA with high spatial resolution at sub cellular level.
However:
- only profile a low number of genes
- low sensitivity in mRNA detection
- time consuming
A. Image-based (in situ sequencing & in situ hybridization): profile mRNA with high spatial resolution at sub cellular level.
However:
- only profile a low number of genes
- low sensitivity in mRNA detection
- time consuming
B. Sequencing-based (e.g. Visium): capture position-barcoded mRNA with non-gene-specific probes. Can profile the entire transcriptome & are fast.
However:
Low-resolution spots can contain multiple cells with several blended cell types. This can conceal the true tissue biology.
However:
Low-resolution spots can contain multiple cells with several blended cell types. This can conceal the true tissue biology.
2️⃣ What is Cellular Deconvolution & why is it important?
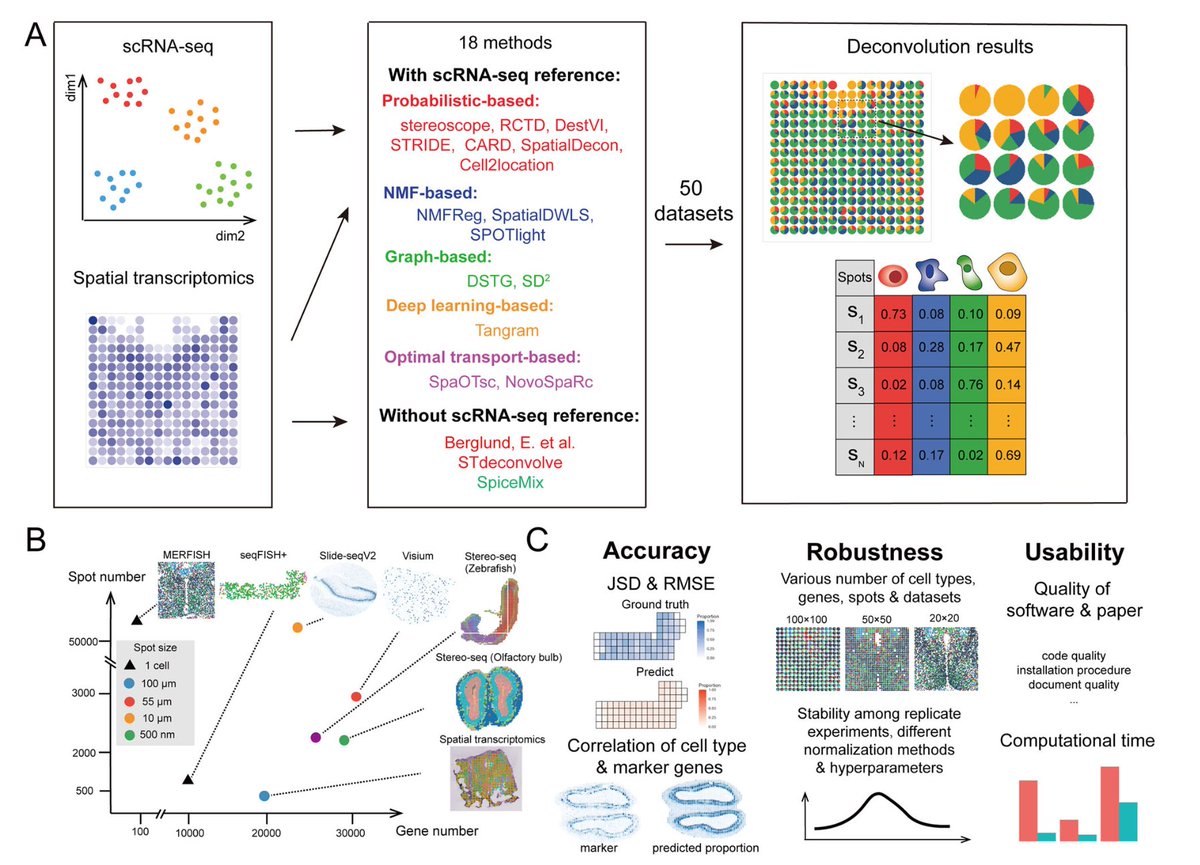
In sequencing-based methods (B above), cellular deconvolution means quantifying proportions of different cell types among the blended captured spots. With this, the profiled tissue has a more fine-grained representation.
In sequencing-based methods (B above), cellular deconvolution means quantifying proportions of different cell types among the blended captured spots. With this, the profiled tissue has a more fine-grained representation.
3️⃣ Which cellular decomposition methods were benchmarked?
The 18 methods are:
1. CARD
tinyurl.com/arztf9bs
2. Cell2location
tinyurl.com/ymy4fn68
3. RCTD
tinyurl.com/2p9xkyp9
4. DestVI
tinyurl.com/mvtweytv
5. stereoscope
tinyurl.com/yvszhfc7
The 18 methods are:
1. CARD
tinyurl.com/arztf9bs
2. Cell2location
tinyurl.com/ymy4fn68
3. RCTD
tinyurl.com/2p9xkyp9
4. DestVI
tinyurl.com/mvtweytv
5. stereoscope
tinyurl.com/yvszhfc7
6. SpatialDecon
tinyurl.com/2p93jzz4
7. STRIDE
tinyurl.com/ew7jbukh
8. NMFreg
tinyurl.com/mv6xn7sr
9. SpatialDWLS
tinyurl.com/yfb58dr9
10. SPOTlight
tinyurl.com/2sy9dwtc
11. DSTG
tinyurl.com/2vdh4zvu
12. SD2
tinyurl.com/mpntkd7e
tinyurl.com/2p93jzz4
7. STRIDE
tinyurl.com/ew7jbukh
8. NMFreg
tinyurl.com/mv6xn7sr
9. SpatialDWLS
tinyurl.com/yfb58dr9
10. SPOTlight
tinyurl.com/2sy9dwtc
11. DSTG
tinyurl.com/2vdh4zvu
12. SD2
tinyurl.com/mpntkd7e
13. Tangram
tinyurl.com/mrpn6puj
14. Berglund
tinyurl.com/2kdk4585
15. SpiceMix
tinyurl.com/3xmpse6v
16. STdeconvolve
tinyurl.com/4uar2hzs
17. SpaOTsc
tinyurl.com/554dbrjm
18. novoSpaRc
tinyurl.com/2w44wnap
tinyurl.com/mrpn6puj
14. Berglund
tinyurl.com/2kdk4585
15. SpiceMix
tinyurl.com/3xmpse6v
16. STdeconvolve
tinyurl.com/4uar2hzs
17. SpaOTsc
tinyurl.com/554dbrjm
18. novoSpaRc
tinyurl.com/2w44wnap
The methodology behind these tools is either:
- probabilistic modeling
- non-negative matrix factorization(NMF)
- graphs
- optimal-transport(OT)
- deep learning
Berglund, SpiceMix & STdeconvolve are scRNAseq reference-free. The other 15 methods require same-tissue scRNAseq data
- probabilistic modeling
- non-negative matrix factorization(NMF)
- graphs
- optimal-transport(OT)
- deep learning
Berglund, SpiceMix & STdeconvolve are scRNAseq reference-free. The other 15 methods require same-tissue scRNAseq data

4️⃣ Datasets & technologies:
Image-based real data:
- seqFISH
- MERFISH
Sequencing-based real data:
- ST
- 10X Visium
- Slide-seqV2
- stereo-seq
Simulated:
Due to high resolution & good annotation, the image-based real data was used as ground truth for simulating low-res spots.
Image-based real data:
- seqFISH
- MERFISH
Sequencing-based real data:
- ST
- 10X Visium
- Slide-seqV2
- stereo-seq
Simulated:
Due to high resolution & good annotation, the image-based real data was used as ground truth for simulating low-res spots.
This scatter plot shows the resolution of each spot and number of spots & genes in each of the 6 technologies used to generate the real datasets employed in this benchmark.
All in all, 50 datasets were generated.
All in all, 50 datasets were generated.

Datasets were simulated by binning the cells with a unified square size.
The ground truth was calculated according to the number of cells with different cell types in each spot.
Different resolutions of spots can then be simulated by different sizes of the binning squares.
The ground truth was calculated according to the number of cells with different cell types in each spot.
Different resolutions of spots can then be simulated by different sizes of the binning squares.

5️⃣ Performance assessment by:
A. accuracy: multiple metrics applied on all methods & datasets
B. robustness: different cell type composition, spatial transcriptomics technique, number genes & number of spots tested in all methods
C. usability: efficiency, code & documentation
A. accuracy: multiple metrics applied on all methods & datasets
B. robustness: different cell type composition, spatial transcriptomics technique, number genes & number of spots tested in all methods
C. usability: efficiency, code & documentation

6️⃣ Benchmarking results
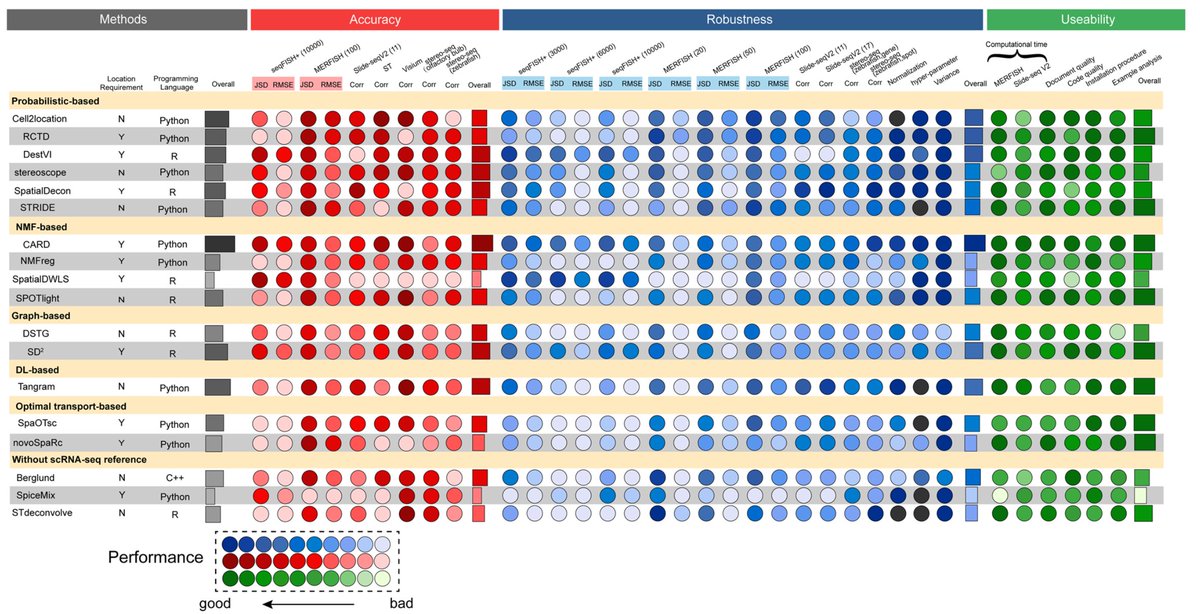
This is the summary table with the performance of all methods. Darker spots represent better performance.
‼️The authors conclude that generally, Cell2location & DestVI performed consistently well across datasets & scenarios.
This is the summary table with the performance of all methods. Darker spots represent better performance.
‼️The authors conclude that generally, Cell2location & DestVI performed consistently well across datasets & scenarios.

7️⃣ The accuracy metrics used are:
- Jensen–Shannon divergence (JSD)
- root-mean-square error (RMSE)
- Pearson correlation coefficient (PCC)
Most methods did well with MERFISH-based simulations, but only CARD, DestVI & SpatialDWLS were high-performing with seqFISH+ (fewer spots).
- Jensen–Shannon divergence (JSD)
- root-mean-square error (RMSE)
- Pearson correlation coefficient (PCC)
Most methods did well with MERFISH-based simulations, but only CARD, DestVI & SpatialDWLS were high-performing with seqFISH+ (fewer spots).
8️⃣ Robustness: simulated experiments under multiple different conditions
A. number genes: 10,000, 6000 and 3000 genes randomly chosen in the seqFISH+ dataset & 26,365, 18,000 and 9000 in stereo-seq
B. binning size: 20, 50 and 100 μm (MERFISH) & 5, 10 and 15 μm (stereo-seq)
A. number genes: 10,000, 6000 and 3000 genes randomly chosen in the seqFISH+ dataset & 26,365, 18,000 and 9000 in stereo-seq
B. binning size: 20, 50 and 100 μm (MERFISH) & 5, 10 and 15 μm (stereo-seq)
C. 17 original cells types & 11 integrated cell types tested in SlideseqV2 datasets
D. two input normalization methods on the Visium data
E. varying chosen hyperparameters in Visium & SlideseqV2
F. repeat experiments 3 times with the seqFISH+ data with 10,000 genes per spot
D. two input normalization methods on the Visium data
E. varying chosen hyperparameters in Visium & SlideseqV2
F. repeat experiments 3 times with the seqFISH+ data with 10,000 genes per spot
I found particularly interesting the robustness testing on Visium data of two commonly used normalization methods: lognorm & Seurat's sctransform.
For the methods that have their own normalization (the majority), best performance corresponds to using raw input data (obviously).
For the methods that have their own normalization (the majority), best performance corresponds to using raw input data (obviously).
For the methods that did not have their own default normalization, s.a. SpaOTsc & Tangram, normalizing with lognorm triggered better performance.
‼️ What I found really surprising was that all the tested methods performed worse with the sctransform normalization.
‼️ What I found really surprising was that all the tested methods performed worse with the sctransform normalization.
All in all, regarding robustness, CARD, Cell2location, Tangram & SD2 were the most robust methods according to their performance with different resolutions, number of genes, number of spots, and number of cell types.
9️⃣ Usability
Regarding computational runtime, NMFreg, STRIDE & Tangram were most efficient.
Most methods had high-quality tutorials & code.
In particular, CARD, Cell2location, RCTD, & DestVI were user-friendly with helpful tutorials & readable code, making them easy to run.
Regarding computational runtime, NMFreg, STRIDE & Tangram were most efficient.
Most methods had high-quality tutorials & code.
In particular, CARD, Cell2location, RCTD, & DestVI were user-friendly with helpful tutorials & readable code, making them easy to run.
🔟 Guidelines
Taking everything into account, the authors create this flowchart w/ guidelines for users on which cellular deconvolution method to use, depending on their input data.
👏This graphic brings structure to the process of choosing the right method from so many options
Taking everything into account, the authors create this flowchart w/ guidelines for users on which cellular deconvolution method to use, depending on their input data.
👏This graphic brings structure to the process of choosing the right method from so many options

A. As expected, most important question is whether additional scRNAseq data from the same tissue is also available
B. Then,the technology platform dictates the number of spots in the data, which informs the choice of method
C. Lastly, the target celltype resolution also matters
B. Then,the technology platform dictates the number of spots in the data, which informs the choice of method
C. Lastly, the target celltype resolution also matters
Benchmarking studies are cool❤️
This paper is an important contribution to the #SpatialTranscriptomics methods literature & useful for #Bioinformatics Data Scientists looking to apply cellular decomposition to their data
Congrats to the authors & thanks for your thorough work💯
This paper is an important contribution to the #SpatialTranscriptomics methods literature & useful for #Bioinformatics Data Scientists looking to apply cellular decomposition to their data
Congrats to the authors & thanks for your thorough work💯
• • •
Missing some Tweet in this thread? You can try to
force a refresh


