Orwell2024🏒 Profile picture
Mar 28, 2023 6 tweets 3 min read Read on X
200 ha. 20MW average power (random, not at night).

We need +70 of those parks to paper match Isar 2 reactor (which runs 24/7). With storage? 150x

The lifetime ~30 years. Then it is waste. New mining / resource exploitation needed with fossils.

Net zero or insanity? ImageImage
So lets add storage (50% efficiency). 150 such parks. Makes 150x200=30.000 ha (min). That is the total area of Munich. PVs is trash in 30 years and needs continuous replacement (fresh fossil powered mining + industry) somewhere in the world.

A "sustainable" plan. #greenwashing Image
The total primary power need for Germany is 460 GW. You would need 460/1.4*30.000 ha ~ 1.5x Bavaria (1.5 times red here) as PV park surface. Sounds like a plan. Image
The Great Wall is the largest man-made project in the world. 20,000 km (~2000km2). Germany will beat this by 50x with the Great Solar Park, 100.000km2. 50 times the Great Chinese Wall. Life time 30 year only.

1M km of 100 m PVs. Earth-Moon back twice.

Wir schaffen das 🙂 Image
A NL engineer showed a calculation that NL does not have sufficient area (incl. the complete Dutch North Sea sector) to produce sufficient energy. The RE Amish utopia only works if Randstad emigrates to Africa and only the farmers stay. Without fossils or nuclear, no NL society.
To the moon and back. That will be generation 2 (you need to make one every 30 years) of the Great Solar Wall. Generation 3 will be on the moon (problem: night is 15 days long there).

The Tower of Babel (to reach the god of the sun) project can begin. Image

• • •

Missing some Tweet in this thread? You can try to force a refresh
 

Keep Current with Orwell2024🏒

Orwell2024🏒 Profile picture

Stay in touch and get notified when new unrolls are available from this author!

Read all threads

This Thread may be Removed Anytime!

PDF

Twitter may remove this content at anytime! Save it as PDF for later use!

Try unrolling a thread yourself!

how to unroll video
  1. Follow @ThreadReaderApp to mention us!

  2. From a Twitter thread mention us with a keyword "unroll"
@threadreaderapp unroll

Practice here first or read more on our help page!

More from @orwell2022

Jul 6
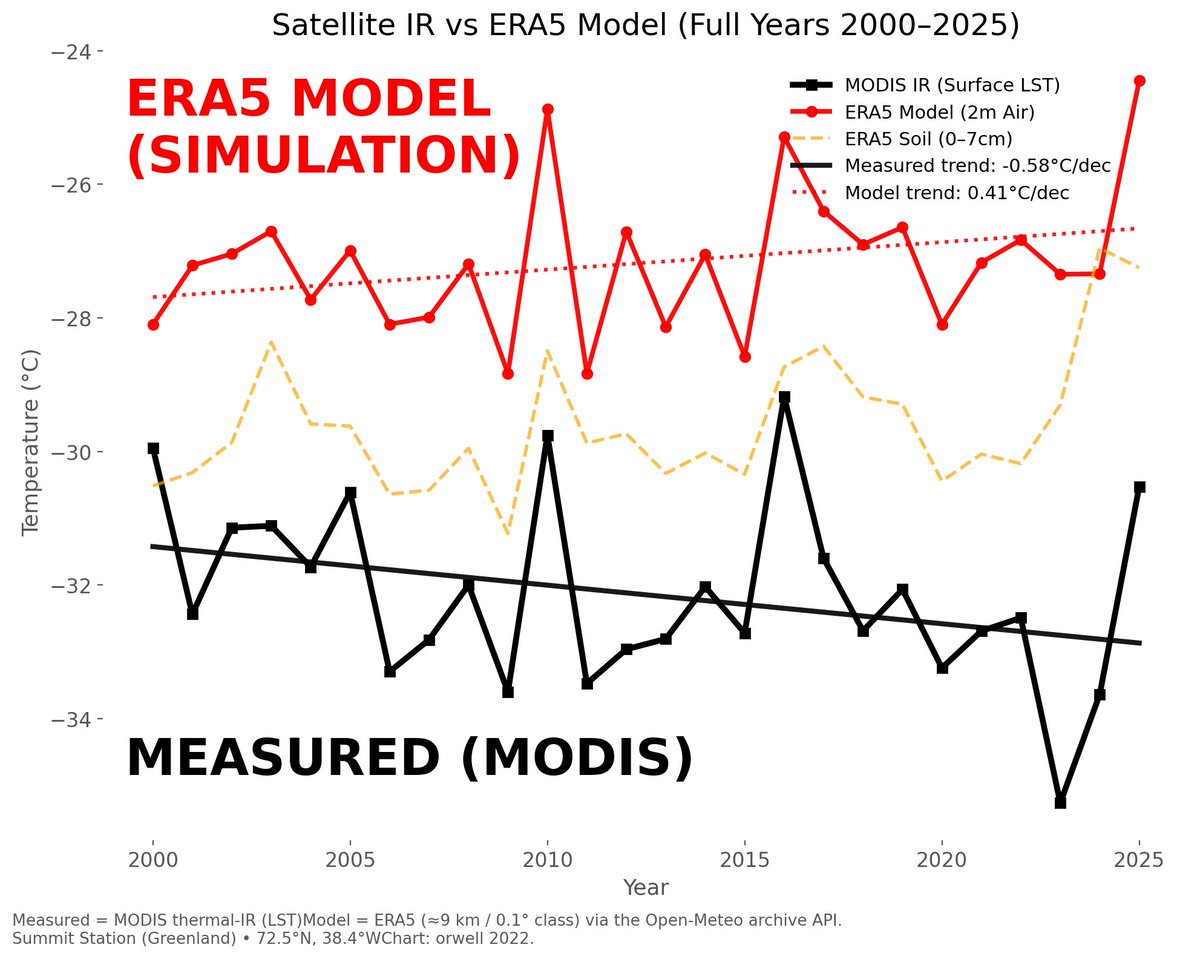
UAH is a model inference, not a measurement. It can’t be tested, yet many treat it like real raw. Calling that a ‘measurement’ is wrong. Neither Lindzen nor us take it seriously. It starts in a cold period, with no long-term data — adjusted, multi mission stitched SW composite.🚮
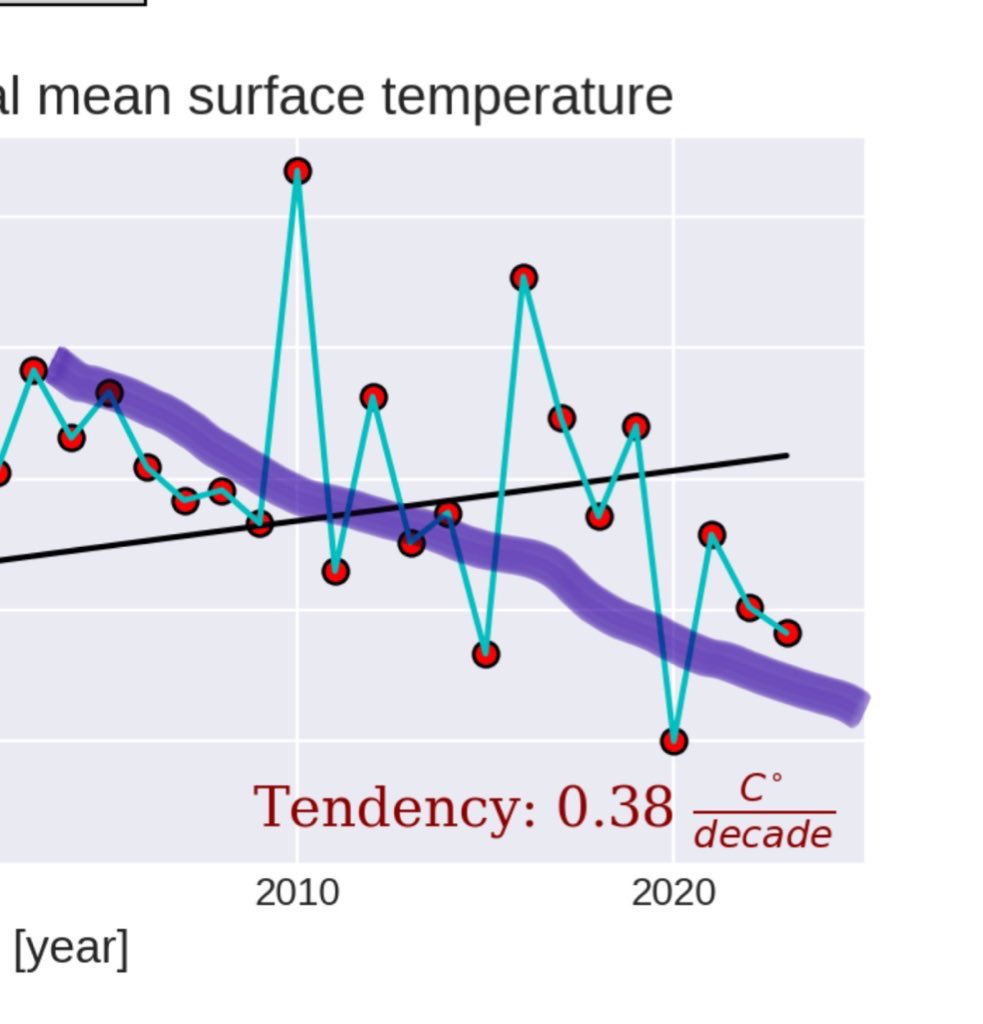
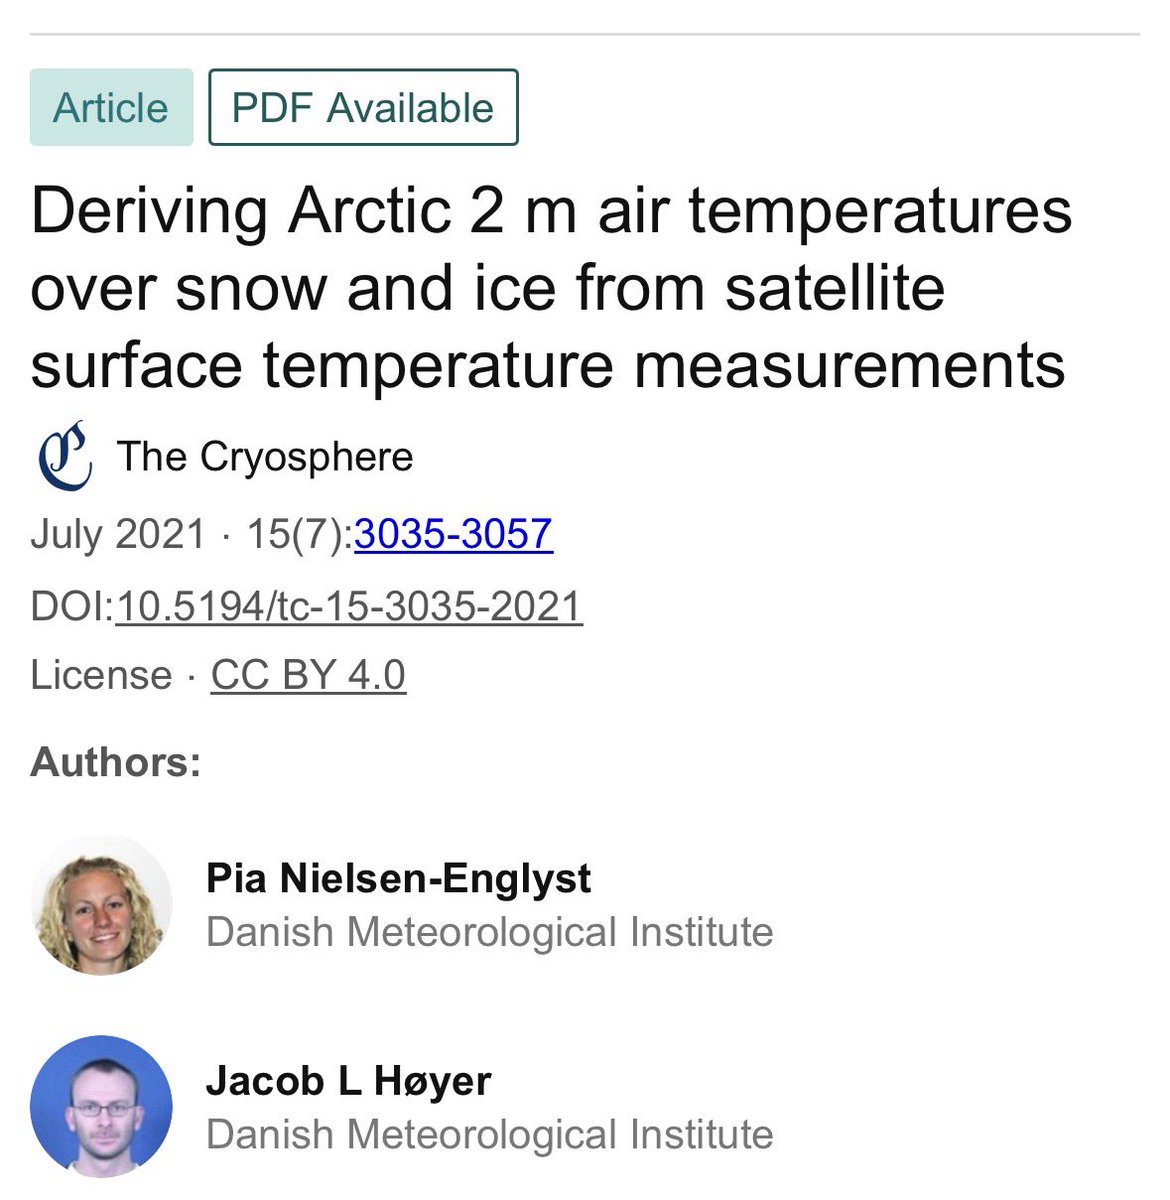
UAH is not measurement — it’s model-driven inference. Satellites detect radiance, not temperature. The ‘trend’ is built through weighting functions, drift corrections, and stitched instruments. It’s untestable, synthetic, and not suitable for long-term climate baselines. Image
Image
Image
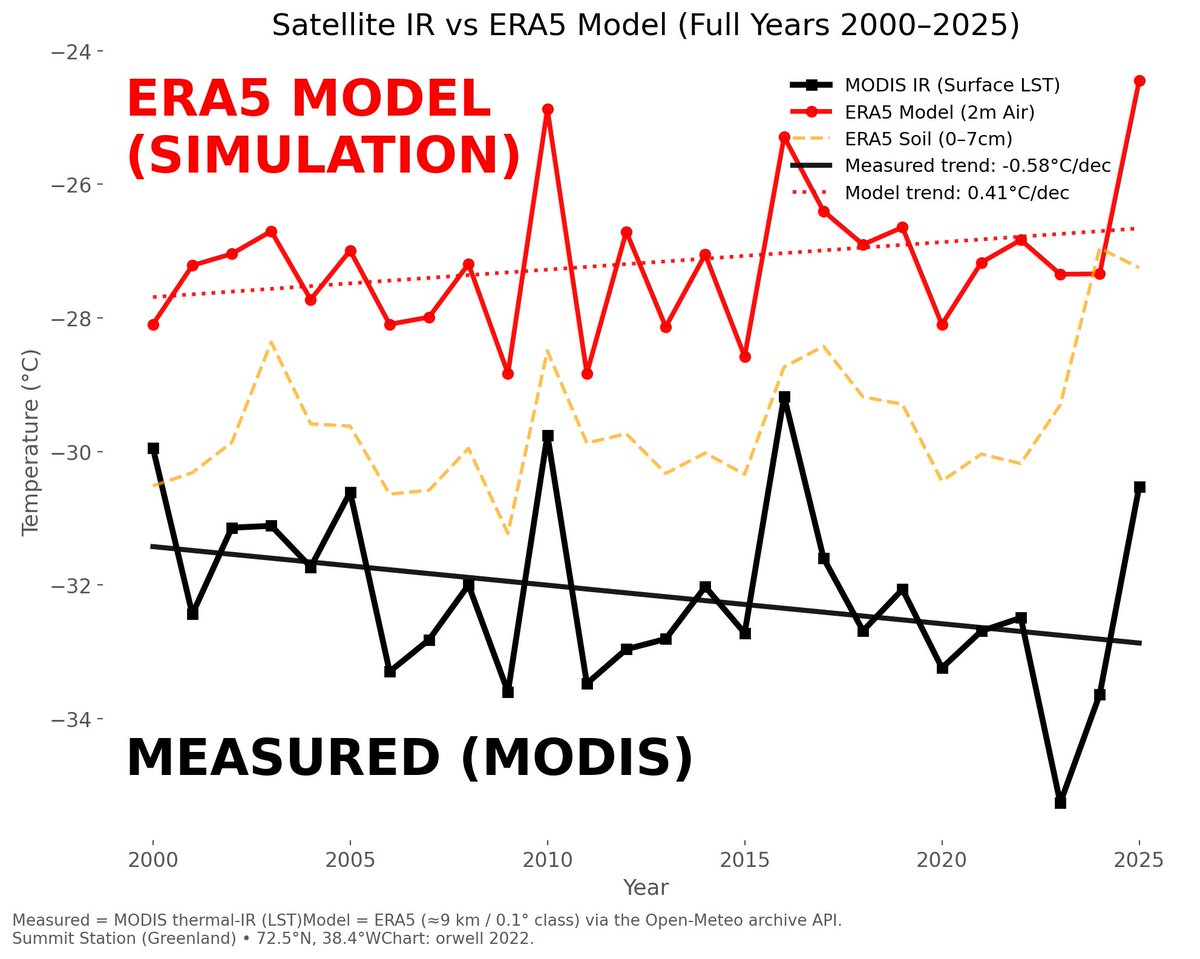
It’s astonishing how confidently some treat satellite-based inferences as god in heaven like truth. These are SW model outputs, not reliable measurements. Treating them as accurate fact is scientifically indefensible. If you do so, expect your credibility to be challenged. Image
Read 4 tweets
Jul 1
London is glowing today. Wide urban heat plume. Not “climate change.” Just real estate and concrete. The effect is visible. Quantifiable. Known. This should be a good study day to quantify UHI in more detail once the IR satellite pictures come in. Image
Image
2/ We start low tech. Actually nothing more is needed. There is over 6°C urban heat. It's embarrassing to pretend today's 33°C are comparable to 100 years ago. Subtract 6–8°C for UHI and you get... 25–27°C. Welcome back to reality. Image
3/ Nighttime, Tmin. Watch how they flatten the colors. You’re not supposed to notice the 7°C UHI. We unflatten the colors. Look again: you see it now? Image
Read 6 tweets
Jun 29
Stockholm downtown: Where’s the UHI correction?

QCU = raw data
QCF = adjusted data

Same numbers.

C A N -- Y O U -- S E E -- IT

Fredrik? Show us.
We can’t see it.

Where exactly is the downward adjustment of 2C-4C? That's the bias you have in 2025. Image
We can also do from SE raw. And we can also show how rural stations look. Frederik does like them. Climate agenda is measured in downtowns of the capitals? Image
Not sure if it’s normal that amateurs now have to lecture academics…?

The downtown station logs hourly=no need for even Ekholm, no need for re-sampling. Does Frederik even know what we mean? Nothing is adjusted. Also PHA leaves it as is as it only detects breakpoints (not UHI). Image
Read 5 tweets
Jun 27
1/ +++🚨BREAKING🚨+++

Yes. Hausfather & Berkeley Earth are pushing it.
But it’s not a measurement. Not one station shows that.
It’s what you get when you aggregate rot over time.

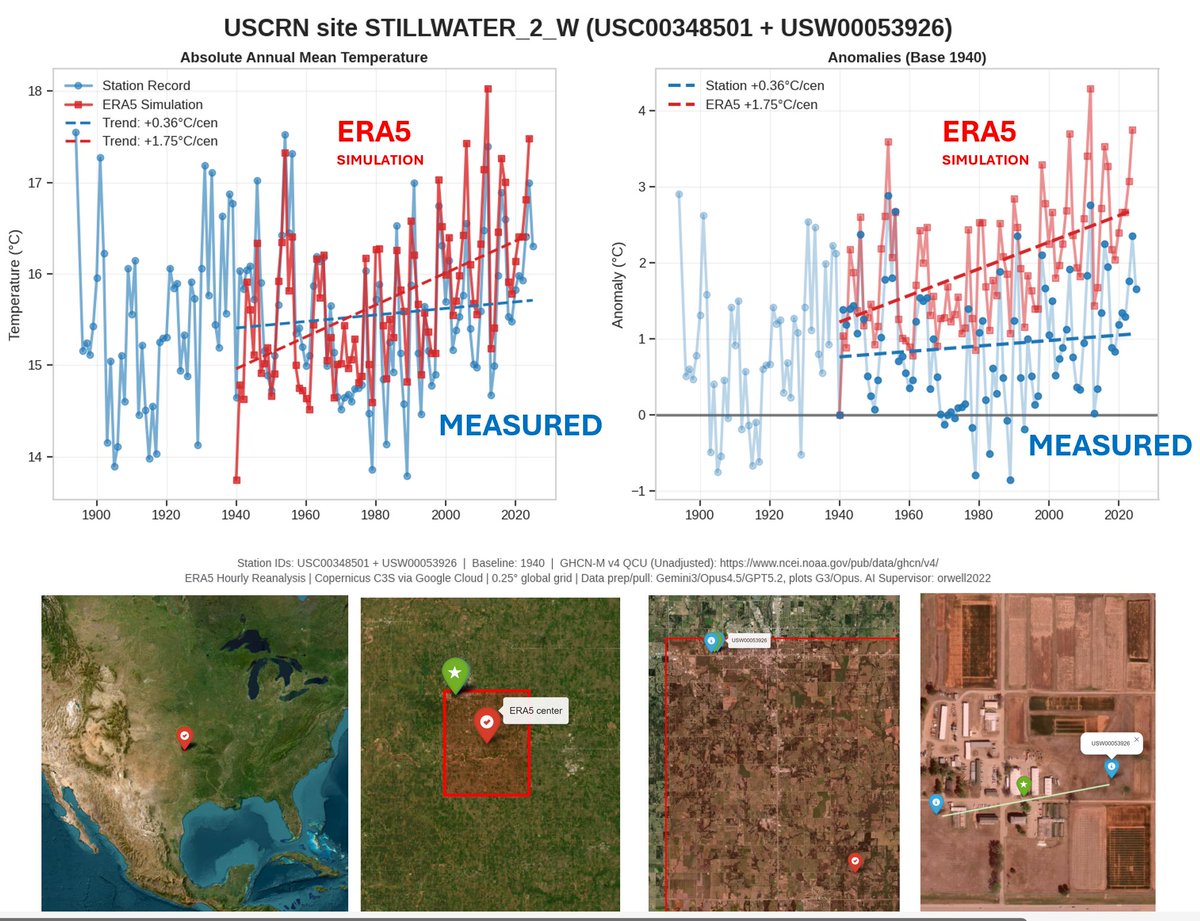
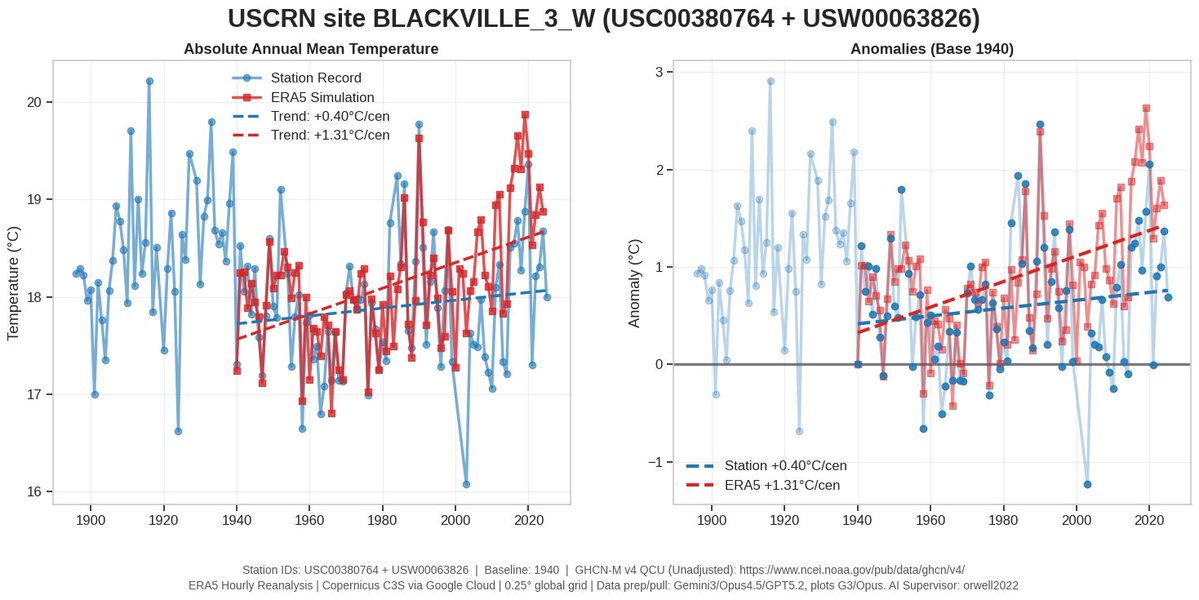
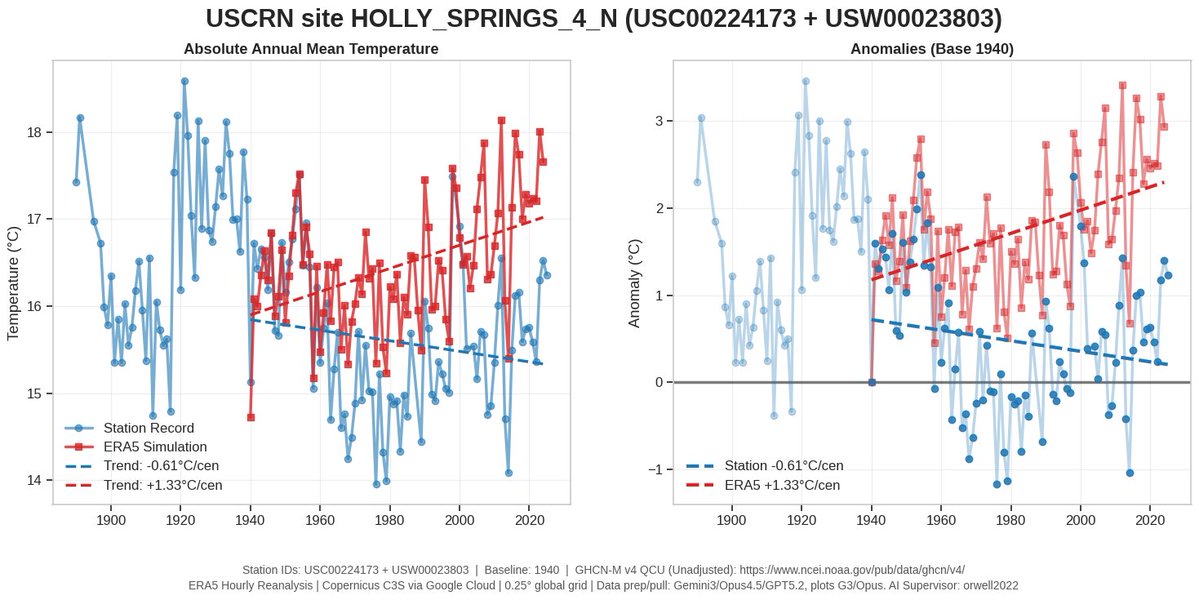
On the left: 8 pristine USCRN sites. Same y-scale.
Now look what they did.👇 Image
2/ 🚨 BREAKING 🚨

We overlay. Do you see it now?

👉 They erased the real past.
👉 They had no data to do so.
👉 It's pure statistical deception—and wrong.

How? All exposed in the Wickham et al. (2013) audit thread.🧵

Image
3/ AI to fraud is what DNA was to criminals.

Not optional. Not stoppable.

🧠 Fraud — exposed
📺 MSM — vanished
📄 Journals — obsolete
🎓 Academia — imploded
🏰 Ivory towers — rubble

Resistance is pointless.

github.com/orwell2024/usc…
orwell2024.github.io/GHCN-tools/Wic…
Read 6 tweets
Jun 23
1/ Weil’s beliebt ist: Hohenpeissenberg-Daten – fallen zwar schon nach BU-Filter raus, aber gut: Dr. Connolly war schlau.

Oben: Wie stark sich die Temperatur verändert hat.
Unten: Wie „unrund“ die Messwerte wurden – Entropie der Kommazahlen (h/t Connolly) Image
2/ Was wir hier sehen: Die Datenreihe ist ein Komposit (sehr beliebt, wenig seroes, in der Klima-„Wissenschaft“).
Die Messmethode (und mehr) hat sich verändert – von analogen zu digitalen Sensoren. Die Entropie der Nachkommastellen zeigt das – deutlich.
Image
3/ Diese Wetterstation ist NICHT standortstabil:
praktisch 100 % vom Menschen genutzte Fläche.

🟥 MODIS Urban (Klasse 13)
🟧 MODIS Agrarfläche (12 + 14)
🩸 GHSL Bebauung (2020)

Wer hier „Klima messen“ sagt, betreibt Täuschung.
Blamage für DWD.

Image
Read 12 tweets
Jun 22
1/ The result is simply wrong.
There are 2 stations there — we can compare.
🟥Red: Carlwood
🟩Green: Gatewick
We clearly see the overshoot.
Moreover: They’re using subhourly spikes (error) from a single, low-inertia sensor.
Total incompetence. Image
2/ Using TMAX from a low-quality single urban sensor is already peak incompetence.

But they go further — they take the spikes.
Even top-tier stations like USCRN show 2–3°C error at peak forcing.
USCRN uses triple sensors — worst spikes get voted out.

Image
3/ The UK has nothing like the USCRN triple-sensor setup.

So when two nearby stations disagree, the right move is simple:
Discard the implausible one — in this case, Charlwood.
What does the agenda-captured @metoffice do?
They run with the error.
They hoax the public.
ISO9001🤡 Image
Image
Read 6 tweets

Did Thread Reader help you today?

Support us! We are indie developers!


This site is made by just two indie developers on a laptop doing marketing, support and development! Read more about the story.

Become a Premium Member ($3/month or $30/year) and get exclusive features!

Become Premium

Don't want to be a Premium member but still want to support us?

Make a small donation by buying us coffee ($5) or help with server cost ($10)

Donate via Paypal

Or Donate anonymously using crypto!

Ethereum

0xfe58350B80634f60Fa6Dc149a72b4DFbc17D341E copy

Bitcoin

3ATGMxNzCUFzxpMCHL5sWSt4DVtS8UqXpi copy

Thank you for your support!

Follow Us!

:(