Thank you @RonStoeferle for the endorsement!
How are we looking at the gold market that may be different from the others including research produced by large brokerage houses?
🧵(1/9)
$gold #Gold
How are we looking at the gold market that may be different from the others including research produced by large brokerage houses?
https://twitter.com/RonStoeferle/status/1642457221291188225
🧵(1/9)
$gold #Gold
First, mapping the level of M2 money supply onto the gold price offers increased utility relative to monitoring its rate-of-change alone.
The level shows gold reached a major support in Nov 2022.
(2/9)
The level shows gold reached a major support in Nov 2022.
(2/9)

Here we use a projection of a 94 year old gold price from 1929. One may think, what really can that tell us about the modern gold market?
It turns out the mid-cycle-level has functioned as support/resistance many times in the past 50 years and 4 times in the last 7 yrs.
(3/9)
It turns out the mid-cycle-level has functioned as support/resistance many times in the past 50 years and 4 times in the last 7 yrs.
(3/9)

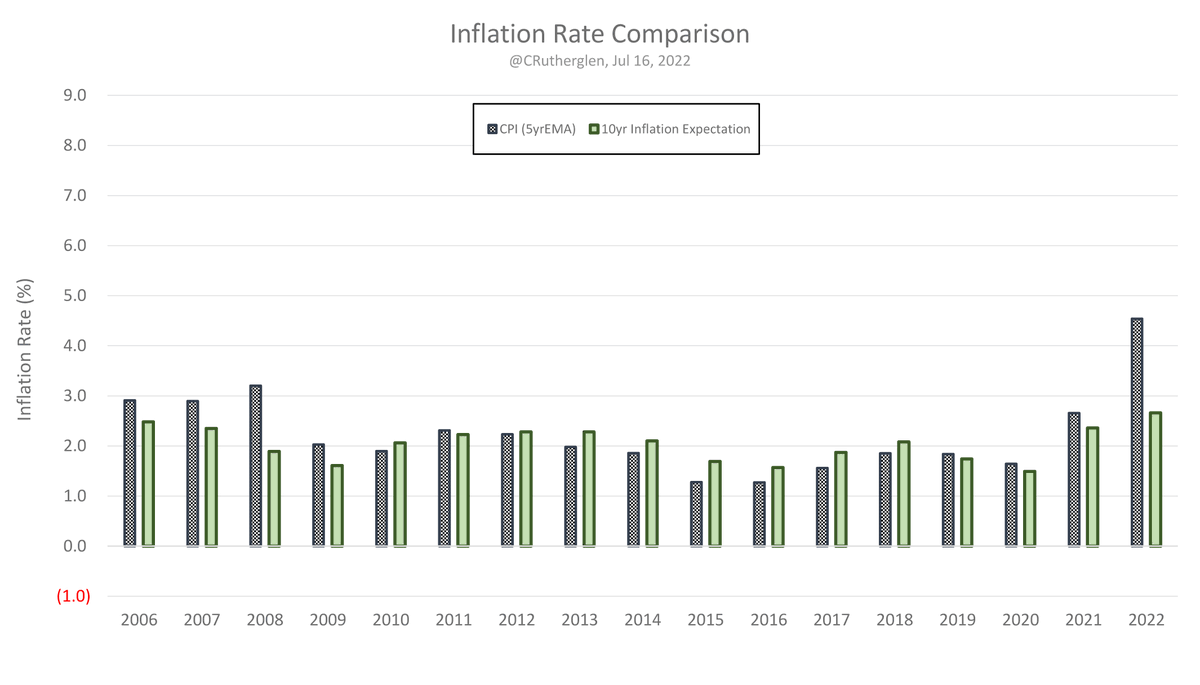
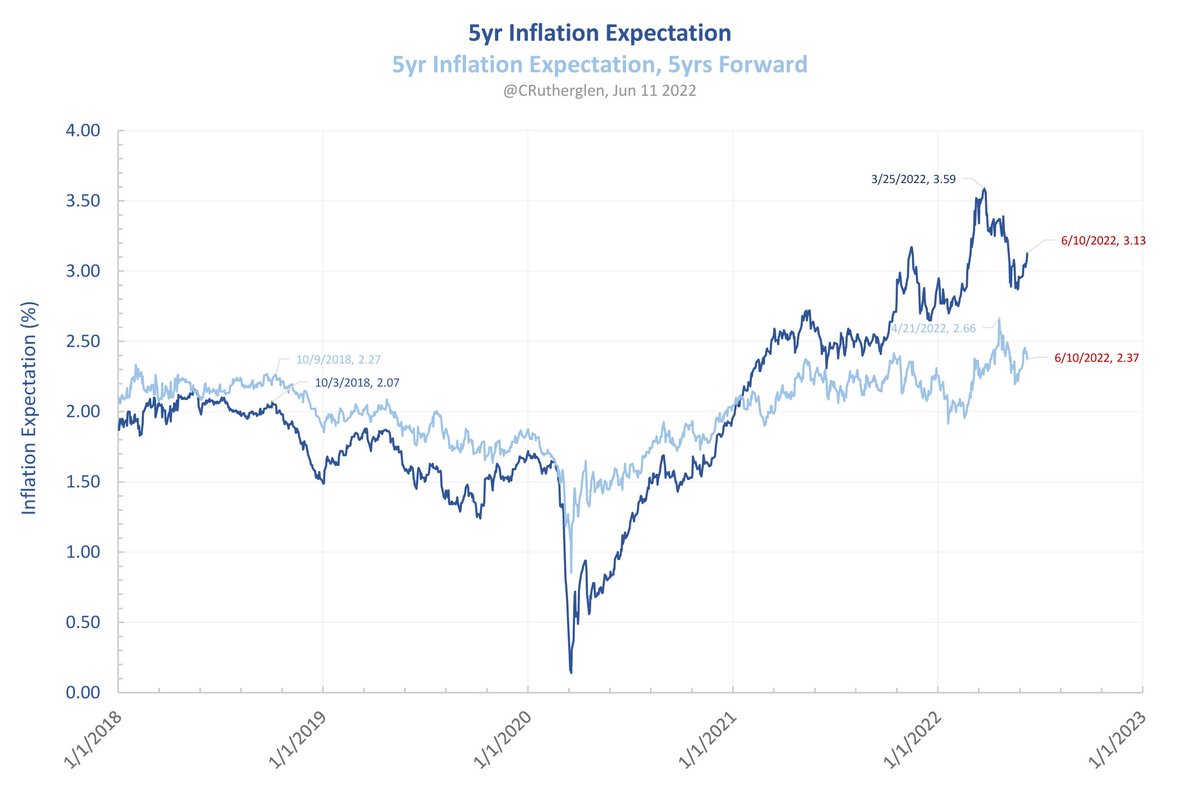
The two drivers of the gold price are rising inflation expectations and a falling long-term yield.
For much of 2022, gold had one foot on the 'brake' (from rising yields) and one foot on the 'accelerator' (from rising inflation expectations).
Thus, price did not do much.
(4/9)
For much of 2022, gold had one foot on the 'brake' (from rising yields) and one foot on the 'accelerator' (from rising inflation expectations).
Thus, price did not do much.
(4/9)

As early as March 2022, gold began pricing in higher trending inflation expectations. Concurrent with this, the CPI inflation rate was topping >8%.
To this day, gold has continued to price in a rising inflation expectation thus closing the gap with the CPI inflation rate.
(5/9)
To this day, gold has continued to price in a rising inflation expectation thus closing the gap with the CPI inflation rate.
(5/9)

But by Oct-Nov 2022, the 'brake' from rising yields was being let off as the 10yr yield began to initially peak setting up the first leg up for the gold price.
Then by Mar 2023, both feet were on the 'accelerator' as yields began to fall and the gold price took off.
(6/9)
Then by Mar 2023, both feet were on the 'accelerator' as yields began to fall and the gold price took off.
(6/9)

The case for gold is simple when condensed down to its basic elements.
Can this be spotted in real time?
Here is the post from Oct 28, 2022 when gold was forming its Nov 2022 low.
(7/9)
giresearch.substack.com/p/weekly-updat…
Can this be spotted in real time?
Here is the post from Oct 28, 2022 when gold was forming its Nov 2022 low.
(7/9)
giresearch.substack.com/p/weekly-updat…
On March 10, 2023 when the gold price was $1,867 and the 10yr yield had broken-down, we put out the following post:
(8/9)
giresearch.substack.com/p/low-complete…
(8/9)
giresearch.substack.com/p/low-complete…
To learn more, below is a free in depth primer on gold.
(9/9)
giresearch.substack.com/p/primer-for-g…
(9/9)
giresearch.substack.com/p/primer-for-g…
• • •
Missing some Tweet in this thread? You can try to
force a refresh