
Unique and in-depth analysis of the gold and precious metals markets based on data-driven research.
Full analysis at Gold Investor Research on Substack
7 subscribers
 2) The 2007 analog occurred midway through gold's advancing during that period's rate cutting cycle.
 Long term real yields are the main driver of the gold price which means the following are positive for it:

 Intuitively, the 10yr inflation expectation should be a more moderated than YoY CPI due to the longer period it is averaging over.
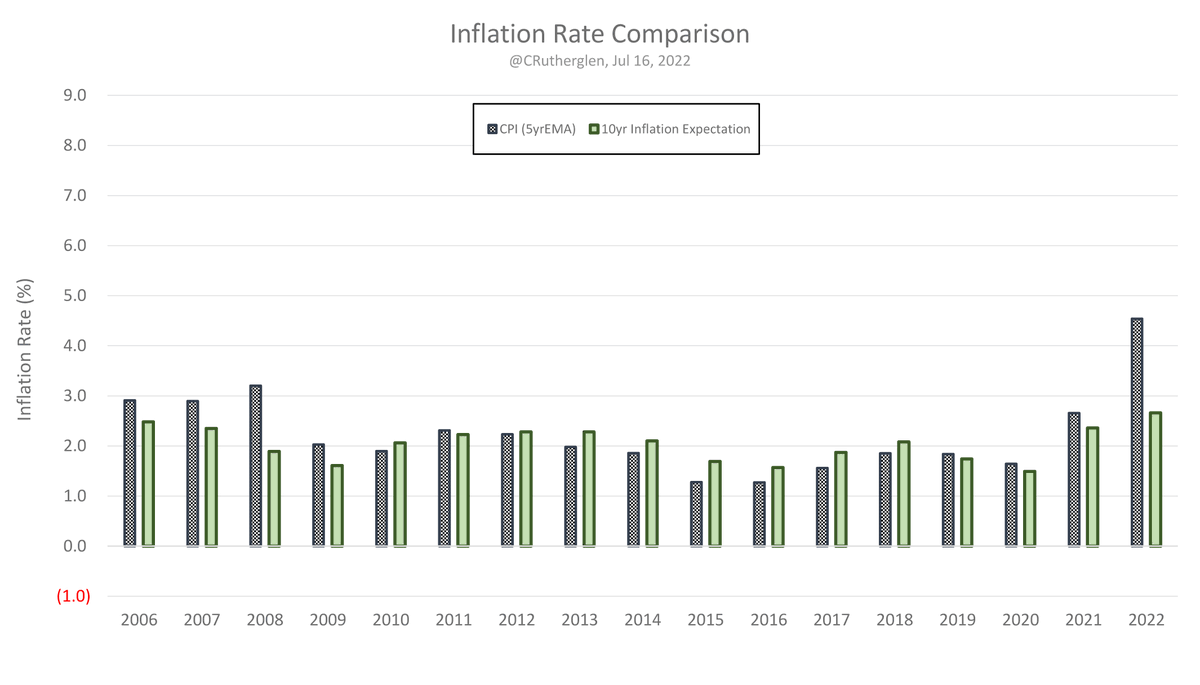
 This helps explain why this new buying interest is not directly translating into a high price.
 What do we have now?
 One could make the case that it is the record negative short-term real-yield (3mo T-Bill yield less CPI YoY % chg) that is in-part holding it up.
 My long-term targets for gold are based on the M2 scaling offset by new mine supply and that data has not changed much.
 Despite the high inflation headline number, only a minority the day's rise (~15%) can be attributed to the change in inflation expectations with both components well off their highs.
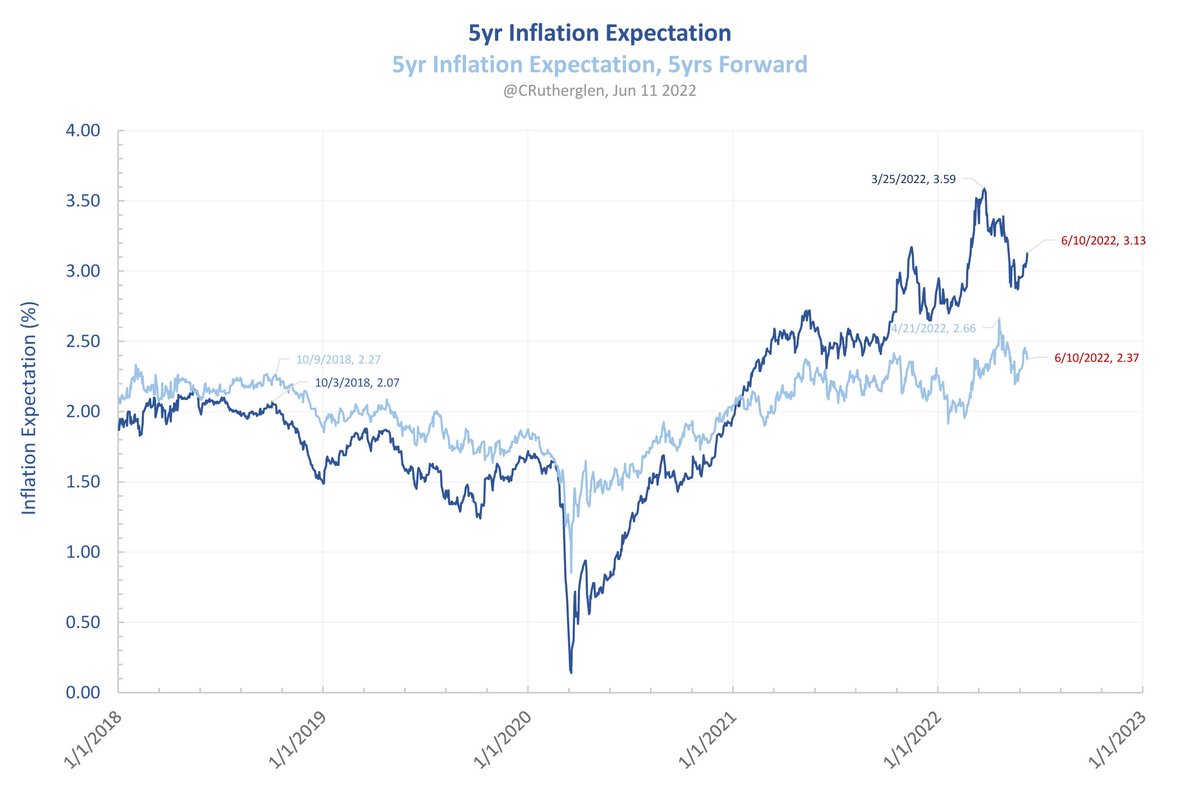


 2⃣During the coming QT2 period (presuming they can get to it before reversing course) one can likely expect positive M2 growth to continue but at a much lower YoY rate compared to the QE4 rate of +$2.8t/yr.
 2⃣Mainly because it does not include in the denominator the mining company's gold-equivalent production per share.
 2⃣Preliminary data for May 10 shows gold futures open interest was up +21.9k contracts on the day despite the price trading down. It looks like a low has formed or is in the process of forming.
 2⃣So far the gold price has held up very well despite the strongly rising 10yr real yield.
 2⃣Here is how options traders have collectively adjusted their Mar'22 contract positions since gold's local low on Jan 28. No sign that traders are significantly betting on a breakout before opex.
 Watch the USD.
 2⃣Looking ahead to the Mar'22 gold options contract intrinsic value curves, as mentioned previously, there is not as much downside protection embedded in the IV curve for this contract compared to Feb'22 contract. Thus, the risk is to the downside as we get closer to expiration.
 2⃣Why this cycle-high is important is because the next cycle-low will likely be the intermediate-cycle-low for gold with a possible target of ~$1720 (+/- a few %).
 2⃣Back in Mar 2021, long-term Treas yields maxed out (coincidently??) at the 1940s controlled yield curve level. Now we are seeing rising rates mainly in the center of the curve (1yr-10yr). Will the 1940s controlled yield curve also mark the high during this advancing in yields?
