Investors prefer liquid funds for building an emergency corpus.
Now that the taxation of debt funds has changed, investors are looking for alternatives.
One option is Arbitrage funds. They offer a #tax advantage.
We compare both categories to see which is better.
A thread 🧵
Now that the taxation of debt funds has changed, investors are looking for alternatives.
One option is Arbitrage funds. They offer a #tax advantage.
We compare both categories to see which is better.
A thread 🧵

Let’s start with the basics: What are Arbitrage Funds?
These are part of the hybrid fund category and invest in arbitrage opportunities.
They follow complex methods.
But to understand the concept, let’s look at a simple example. 👇
These are part of the hybrid fund category and invest in arbitrage opportunities.
They follow complex methods.
But to understand the concept, let’s look at a simple example. 👇
Say #Infosys is trading at a higher price on #NSE compared to BSE.
So, the fund manager buys Infosys on BSE and sells on NSE simultaneously.
Usually, these funds look for mispricing opportunities in the ‘Cash’ and the ‘Futures & Options' markets.
So, the fund manager buys Infosys on BSE and sells on NSE simultaneously.
Usually, these funds look for mispricing opportunities in the ‘Cash’ and the ‘Futures & Options' markets.
Risk is limited in these funds.
Reason: Fund managers don’t invest in equities directly but only in different arbitrage opportunities
Therefore, the chances of Arbitrage Funds delivering negative funds are rare.
Reason: Fund managers don’t invest in equities directly but only in different arbitrage opportunities
Therefore, the chances of Arbitrage Funds delivering negative funds are rare.
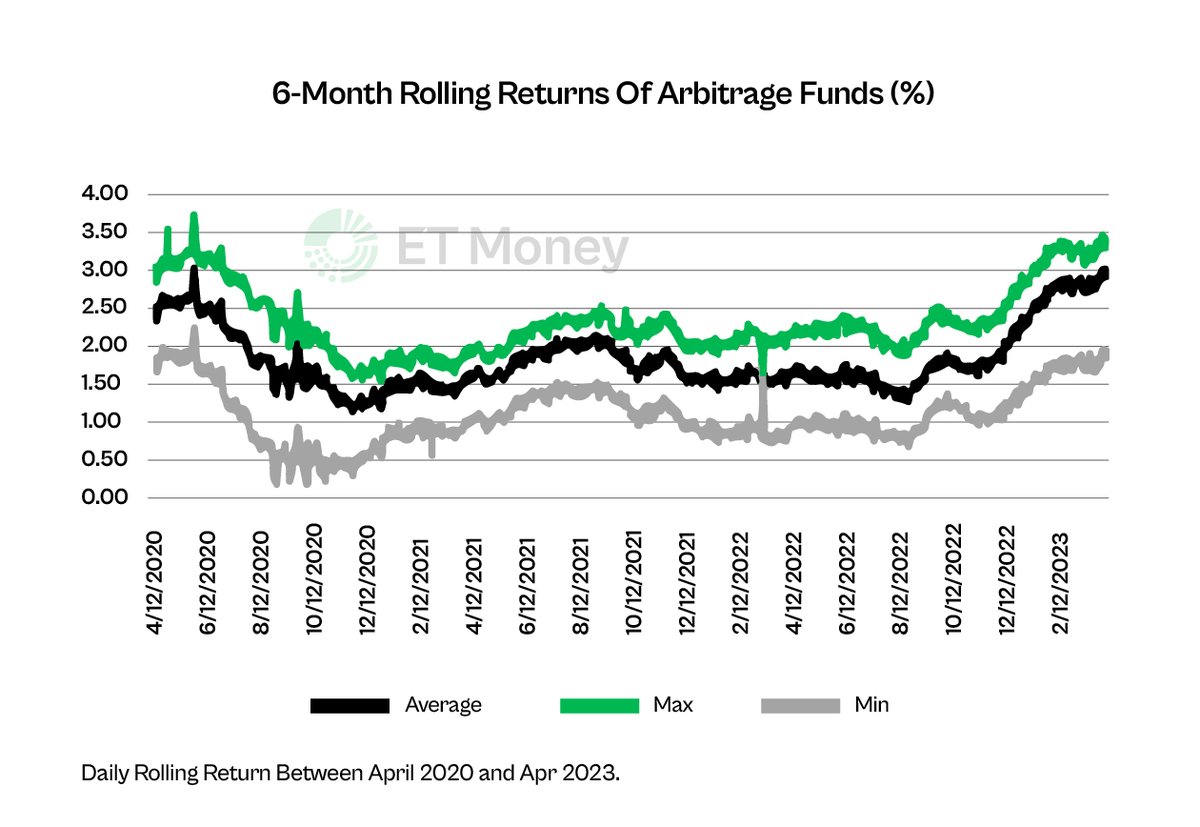
One data point to put things in perspective.
Never have any arbitrage fund delivered negative return over a 6-month period in the last 3 years (See graph)
Never have any arbitrage fund delivered negative return over a 6-month period in the last 3 years (See graph)
Now, let’s look at Liquid funds.
These schemes invest in short-term debt papers maturing within 91 days.
Thus, they are among the least risky debt funds.
They have some credit risk, that is, the company in which the mutual fund has invested defaults.
These schemes invest in short-term debt papers maturing within 91 days.
Thus, they are among the least risky debt funds.
They have some credit risk, that is, the company in which the mutual fund has invested defaults.
SEBI has, however, changed norms in the past few years to protect them from credit risks.
This can be seen by the fact that hardly any liquid fund has delivered a negative return over 6 month period (See graph)
This can be seen by the fact that hardly any liquid fund has delivered a negative return over 6 month period (See graph)

In terms of risk, both categories look similar.
What about returns?
As the average returns of all funds may look diluted, we did something different.
We took the average of the top 5 performing funds in each year to evaluate the categories.
What about returns?
As the average returns of all funds may look diluted, we did something different.
We took the average of the top 5 performing funds in each year to evaluate the categories.

Takeaway:
Liquid Funds have performed better, but the differential isn’t much.
Plus, Arbitrage Funds have a tax advantage, especially for those in the 20% and 30% tax brackets.
The post-tax return, therefore, would be better for Arbitrage funds.
Let’s see how they are taxed👇
Liquid Funds have performed better, but the differential isn’t much.
Plus, Arbitrage Funds have a tax advantage, especially for those in the 20% and 30% tax brackets.
The post-tax return, therefore, would be better for Arbitrage funds.
Let’s see how they are taxed👇
Arbitrage funds are taxed like equity.
Therefore, short-term gains (less than a year) are taxed at 15%.
Long-term gains (after a year) above Rs 1 lakh are taxed at 10%
No tax is levied on gains up to Rs 1 lakh.
Therefore, short-term gains (less than a year) are taxed at 15%.
Long-term gains (after a year) above Rs 1 lakh are taxed at 10%
No tax is levied on gains up to Rs 1 lakh.
After the change in debt funds’ taxation, any gains will be added to an investor’s income and taxed as per the slab.
The following table shows how the post-tax return of these two categories of funds may look like based on historical data.
The following table shows how the post-tax return of these two categories of funds may look like based on historical data.

Arbitrage funds have the potential to deliver better post-tax returns than Liquid funds.
You can park some portion of your emergency funds in Arbitrage funds with other options, such as fixed deposits.
You can park some portion of your emergency funds in Arbitrage funds with other options, such as fixed deposits.
We put a lot of effort into creating such informative threads.
So, if you find this useful, show some love. ❤️
Please like, share, and retweet the first tweet.
So, if you find this useful, show some love. ❤️
Please like, share, and retweet the first tweet.
• • •
Missing some Tweet in this thread? You can try to
force a refresh