
Hey #econtwitter, I'm excited to share a new WP with @conlon_chris about micro data (e.g. consumer surveys) in BLP estimation. Alongside it, we finally released PyBLP version 1.0!
Paper: jeffgortmaker.com/files/micro.pdf
Code: github.com/jeffgortmaker/…
Docs: pyblp.readthedocs.io/en/stable/
1/16
Paper: jeffgortmaker.com/files/micro.pdf
Code: github.com/jeffgortmaker/…
Docs: pyblp.readthedocs.io/en/stable/
1/16


Since releasing version 0.1 with our 2020 paper (onlinelibrary.wiley.com/doi/10.1111/17…), the most common request has been micro moments.
So we dug through published/recent WPs to see how "micro BLP" has been used in practice. Turns out it's been used a lot. Let us know who we missed!
2/16
So we dug through published/recent WPs to see how "micro BLP" has been used in practice. Turns out it's been used a lot. Let us know who we missed!
2/16

Most papers seem to incorporate micro data in problem-specific ways with different notation. This makes it challenging to evaluate different estimators and replicate results.
So we developed a standardized econometric framework that covers most existing cases (and more).
3/16
So we developed a standardized econometric framework that covers most existing cases (and more).
3/16

In our framework, "micro data" are generated by independent surveys of selected consumers (choice-based, stratified, etc), conditional on product-level "aggregate data."
Researchers either have full data (demographics, choices) or summary stats (means, correlations, etc).
4/16
Researchers either have full data (demographics, choices) or summary stats (means, correlations, etc).
4/16


Compatibility, interpretability, confidentiality, and cost are common reasons for using summary stats.
For those with/willing to use full survey results, we derive "optimal micro moments" that match scores. They're easy to compute in a second step with optimal weights/IVs.
5/16
For those with/willing to use full survey results, we derive "optimal micro moments" that match scores. They're easy to compute in a second step with optimal weights/IVs.
5/16


We use Monte Carlo experiments to highlight some practical advice.
Micro data provide *within-market* variation, which is particularly useful with limited *cross-market* variation in demographics and choice sets. See @steventberry and @PhilHaile's nber.org/papers/w27704.
6/16
Micro data provide *within-market* variation, which is particularly useful with limited *cross-market* variation in demographics and choice sets. See @steventberry and @PhilHaile's nber.org/papers/w27704.
6/16


What does "limited cross-market variation" mean in practice?
Linear regression can provide some intuition.
We recommend inspecting 2SLS regressors from Salanie and Wolak's (2022) FRAC approximation to the BLP model. Also see @jamesbrandecon's github.com/jamesbrandecon….
7/16
Linear regression can provide some intuition.
We recommend inspecting 2SLS regressors from Salanie and Wolak's (2022) FRAC approximation to the BLP model. Also see @jamesbrandecon's github.com/jamesbrandecon….
7/16

Which micro summary stats are most informative?
Those that look like the score!
We highlight a few standard micro moments: characteristic-demographic covariances for estimating how preferences vary with demographics, and second choices for unobserved preferences.
8/16
Those that look like the score!
We highlight a few standard micro moments: characteristic-demographic covariances for estimating how preferences vary with demographics, and second choices for unobserved preferences.
8/16


When is it a bad idea to use all info in a micro dataset?
One case is when aggregate and micro data are incompatible.
We give an example where income is measured differently across datasets. Carefully-chosen summary stats use compatible info and discard incompatible info.
9/16
One case is when aggregate and micro data are incompatible.
We give an example where income is measured differently across datasets. Carefully-chosen summary stats use compatible info and discard incompatible info.
9/16

When should micro moments be pooled across markets?
We recommend pooling markets that seem observably similar.
In general, there's a bias-variance trade-off. Market-specific moments may contain more info, but many moments can bias GMM (e.g. Han and Phillips, 2005).
10/16
We recommend pooling markets that seem observably similar.
In general, there's a bias-variance trade-off. Market-specific moments may contain more info, but many moments can bias GMM (e.g. Han and Phillips, 2005).
10/16

What about numerical integration?
We mostly point to our earlier paper, but highlight one pitfall.
Quadrature is great, but it performs poorly for micro moments with demographic discontinuities. We recommend more continuous micro moments or Monte Carlo methods instead.
11/16
We mostly point to our earlier paper, but highlight one pitfall.
Quadrature is great, but it performs poorly for micro moments with demographic discontinuities. We recommend more continuous micro moments or Monte Carlo methods instead.
11/16

Will micro BLP work with different data sizes?
Yes! As long as aggregate and micro data are not too small.
We consider three important asymptotic thought experiments and find that micro BLP's desirable asymptotic properties seem to translate to finite samples.
12/16
Yes! As long as aggregate and micro data are not too small.
We consider three important asymptotic thought experiments and find that micro BLP's desirable asymptotic properties seem to translate to finite samples.
12/16


How does this work in practice?
Our empirical example uses Nielsen scanner and household survey data.
We estimate pre-2017 soda demand in Seattle, predict effects of a 2018 tax, and compare with what happened. Micro data lets us reject big differences by demographics.
13/16
Our empirical example uses Nielsen scanner and household survey data.
We estimate pre-2017 soda demand in Seattle, predict effects of a 2018 tax, and compare with what happened. Micro data lets us reject big differences by demographics.
13/16


A standard concern is that arbitrary assumptions -> large market size -> large logit outside substitution.
So we show how to estimate outside diversion with a quick/cheap second choice survey. We hope these types of surveys will become more common in empirical IO.
14/16
So we show how to estimate outside diversion with a quick/cheap second choice survey. We hope these types of surveys will become more common in empirical IO.
14/16


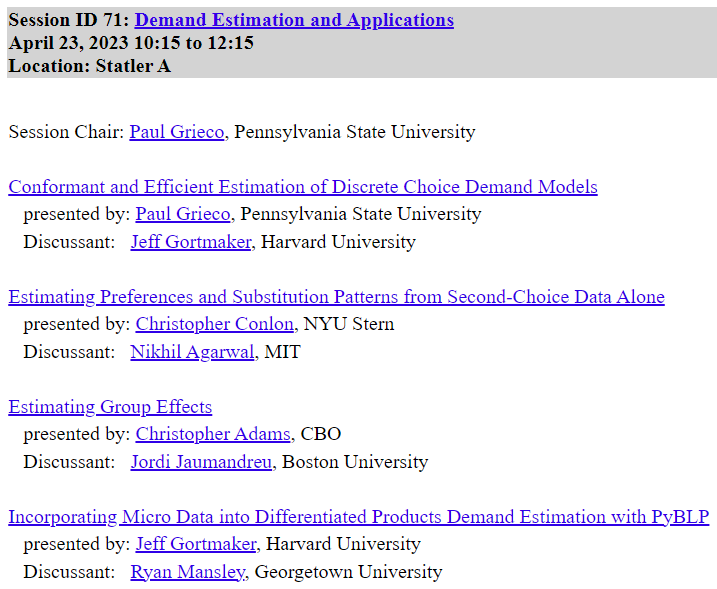
For even more, come see me, Paul Grieco, @conlon_chris, and @ChrisAdamsEcon talk about demand estimation at @IIOC_IO this Sunday!
Paul's paper with @charliemurry @PinkseJoris @StephanSagl (personal.psu.edu/plg15/files/pr…) is a must-read for those interested in micro BLP.
15/16
Paul's paper with @charliemurry @PinkseJoris @StephanSagl (personal.psu.edu/plg15/files/pr…) is a must-read for those interested in micro BLP.
15/16
For those looking to use micro moments with PyBLP, a good place to start is our tutorial estimating Petrin's (2002) model in < 100 lines of code. Let us know what you think!
Tutorial: pyblp.readthedocs.io/en/stable/_not…
Issue tracker: github.com/jeffgortmaker/…
16/16
Tutorial: pyblp.readthedocs.io/en/stable/_not…
Issue tracker: github.com/jeffgortmaker/…
16/16

• • •
Missing some Tweet in this thread? You can try to
force a refresh


