Trading Volatility Profile picture
Apr 30, 2023 6 tweets 3 min read Read on X
ChatGPT can already be used to perform various tasks related to finance and stocks & options trading, including:

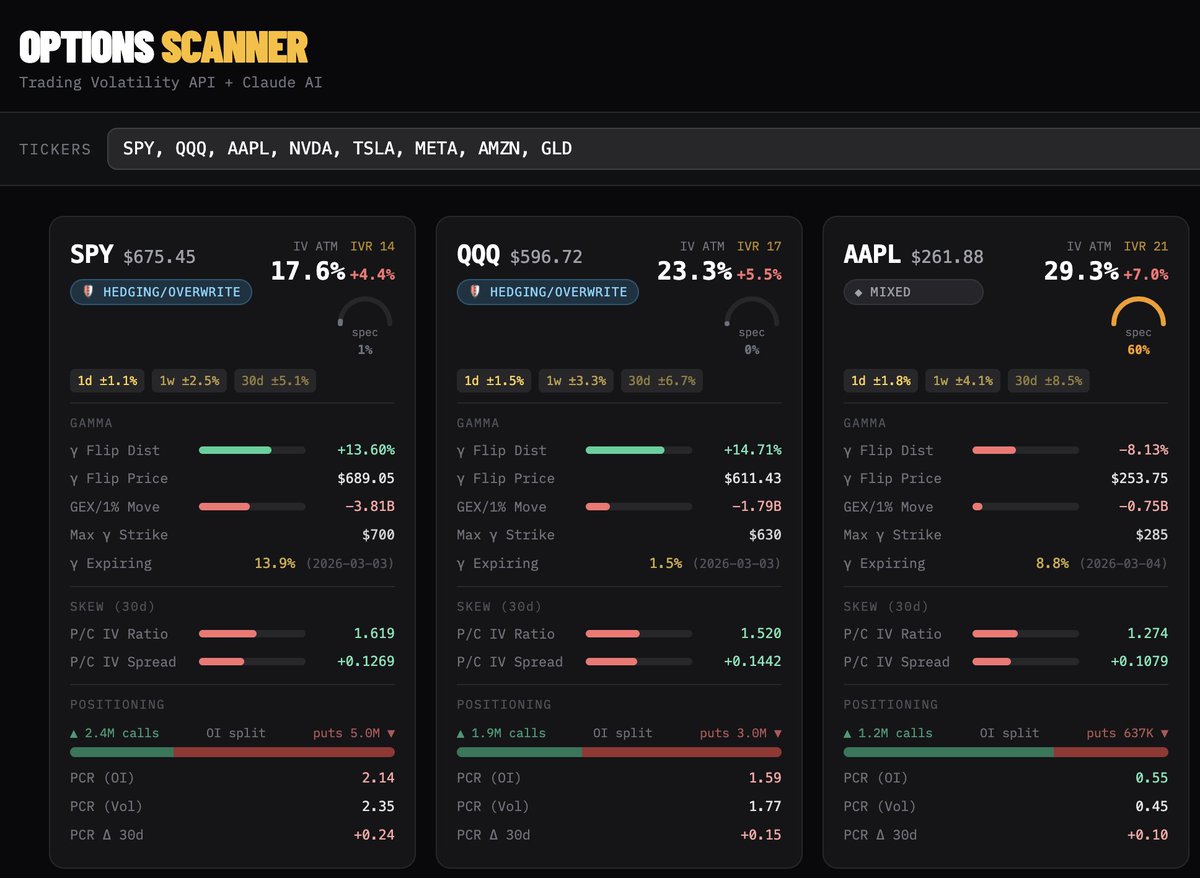
1) get stock and options data for summarizing data:

#stocks
Examples:
- calculate the sum of the call options volume for all strikes in $SPY for an expiration
-… twitter.com/i/web/status/1… Image
2) use probabilities to identify a day's likely closing price.
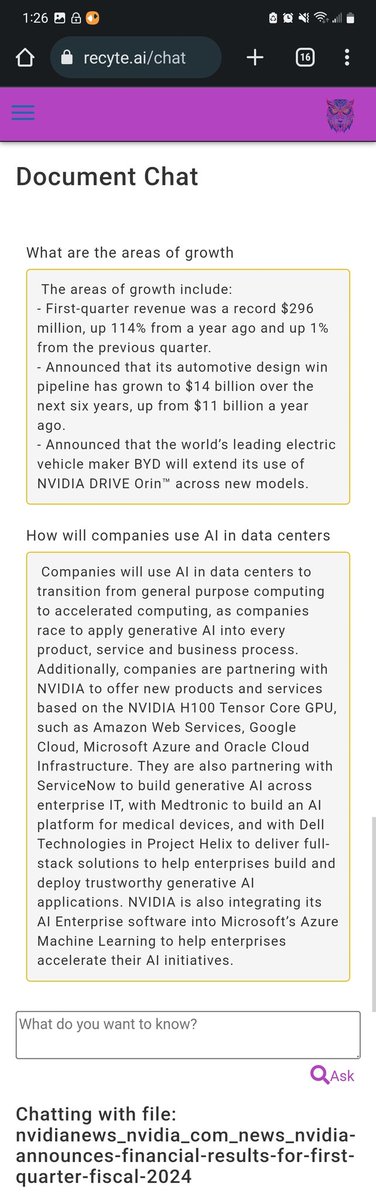
3) Obtain and summarize earnings reports
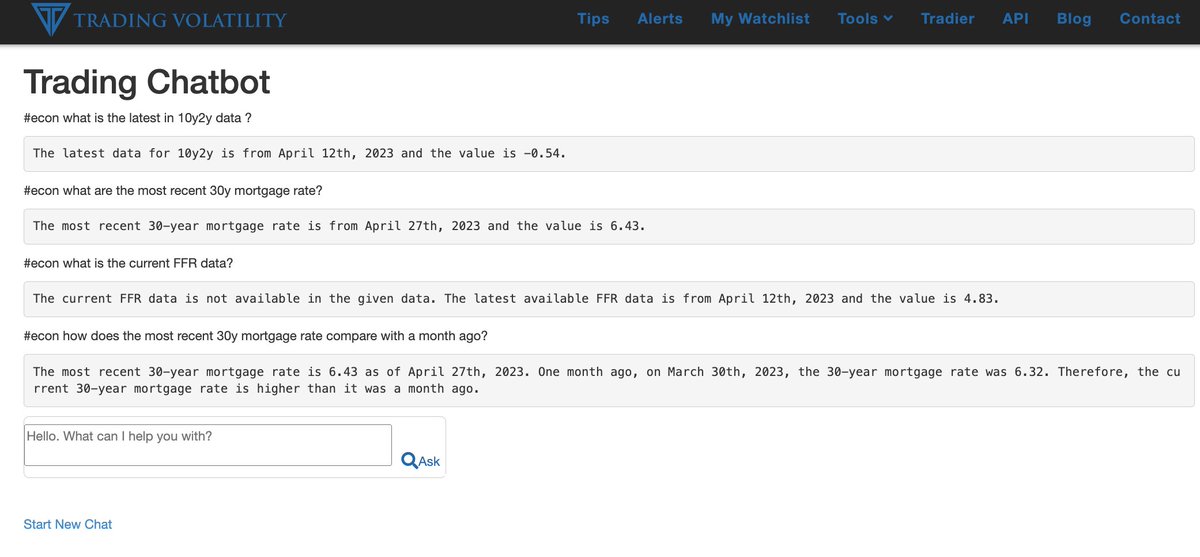
4) Obtain latest economic data.
Examples:
- 10y2y
- 30 year mortgage rate
- Federal Funds Rate Image
5) Added in some contextual awareness, which will be critical when we start feeding the bot large dataframes.
#ChatGPT Image
6) Added some multi-variable queries into our ChatGPT project.
💪

Thank you @hwchase17 and others for building an easy framework!!

Every day brings new capabilities! 🤖 Image

• • •

Missing some Tweet in this thread? You can try to force a refresh
 

Keep Current with Trading Volatility

Trading Volatility Profile picture

Stay in touch and get notified when new unrolls are available from this author!

Read all threads

This Thread may be Removed Anytime!

PDF

Twitter may remove this content at anytime! Save it as PDF for later use!

Try unrolling a thread yourself!

how to unroll video
  1. Follow @ThreadReaderApp to mention us!

  2. From a Twitter thread mention us with a keyword "unroll"
@threadreaderapp unroll

Practice here first or read more on our help page!

More from @TradeVolatility

Dec 8, 2023
$SVIX. $VXX. $UVIX. $UVXY.
Amazingly profitable yet dangerous.

Here's a thread on how to navigate these successfully using three different strategies.

1/
2/ Image
Strategy 1: The VIX Futures Term Structure Strategy
This strategy is based on the term structure of VIX futures. The goal is to take advantage of a persistent roll yield and stay in the ETP that is in the same direction as the roll yield, e.g. SVIX when the term structure is in contango and VXX when the term structure is in backwardation.

You can measure this using a ratio of VX1 (first month VIX futures) to VX2 (second month VIX futures), VX1 to VX3, or spot VIX to VIX3M. It's all the same idea.

While a persistent contango can result is wonderful gains in SVIX, following this strategy as-is will generally have you underperform for a couple reasons.

Many people are watching the zero-line of the term structure (where VX1 = VX2). More often than not, equity support levels are at levels that coincide with a flat term structure. This is generally a better time to buy SVIX than to sell SVIX as the Term Structure trade strategy would suggest.

The near term VIX Futures contracts (front two months) rise together and fall together. The front two months can remain in contango and make daily gains over the course of weeks, which translates directly into losses for SVIX.

Below is a chart of the daily VIX and VIX Futures values over the past 6 months. Despite a persistent contango, there was a large increases through September ad October. However, if you monitor the spread between the lines to determine if that spread is getting narrower you’re going to hit the exit button before larger losses.

3/Image
Read 9 tweets
Sep 7, 2023
We get a lot of questions about our services, so today we're going to take you on a virtual tour of our entire Stocks+ platform!

1/14
It starts at the GEX Charts page, where we track adjusted gamma exposure for 1,200 stocks every day. Get a look at relevant gamma data:
- Net GEX
- GEX by Strike for all Expirations
- GEX by Strike for selected Exp
- IV & Skew
- Buy Rating
- Historical net SA-GEX values vs price
- Historical download button
- Export gamma levels to TradingView & ToS

2/14

Image
Image
Skew Charts page for:
- a visual of the current 30-DTE skew + 5-day history
- table of expected moves
- historical IV vs price
- historical call skew vs price
- historical P/C OI and P/C volume by day
- download button for historical data

3/14
Image
Image
Read 17 tweets
Aug 23, 2023
Key statement from $NVDA's last quarter earnings:

"Companies will use AI in data centers to transition from general purpose computing to accelerated computing, as companies race to apply generative AI into every product, service and business process" Image
From today's release:
"major cloud service providers announced massive NVIDIA H100 AI infrastructures. Leading enterprise IT system and software providers announced partnerships to bring NVIDIA AI to every industry. The race is on to adopt generative AI"
The margins in those H100s is 1000%
Read 6 tweets
Jun 12, 2023
Contango remains strong.

$SVIX nearly doubled since mid-March. 👍
Our 3 primary indicators for trading $VIX ETFs have been negative most of this time.

Negative indicators mean:
==> Short for $VXX $UVXY $UVIX.
Or long $SVIX $SVXY
Read 4 tweets
May 2, 2023
Miss @jam_croissant on TTU last week?

Here's the summary:

1) The Impact of Lagging Effects in the Economy

Over the past decade or two, we have seen various economic instruments being used and invented, each with a lagging effect on different parts of the economy. This article… twitter.com/i/web/status/1…
2) The Complexities of Inflation and the Market: A Multi-Dimensional Approach
Inflation and the market have been hot topics for a while, and there is no shortage of opinions and predictions. However, a lot of the conversations around these topics tend to be overly simplistic and… twitter.com/i/web/status/1…
3) The Coming Inflationary Push and its Impact on the Markets
Inflation has been a major concern for the Federal Reserve (Fed) and the markets lately, with the fear that it might spiral out of control. In a recent discussion, the speaker talks about the historical inflationary… twitter.com/i/web/status/1…
Read 4 tweets
Jan 5, 2022
Clear as day that $ARKK continues to be out of favor since early Nov based on gamma and skew.

Top holdings no longer carrying the negative gamma that was driving prices higher in 2020 & early 2021.

$TSLA $TDOC $COIN $U $ROKU $SHOP $ZM $PATH $SQ $PLTR

stocks.tradingvolatility.net/gexCharts?tick… ImageImageImage
A lot of DIY traders/investors rely on charts, volume, & TA.

This can work well for awhile under the right conditions, but they fail when options flows change without them noticing and then lose a bunch of money.

Too many people are using strategies that will inevitably fail.
Pros have been using options flow data for years for more consistent profits.

It's now available to everyone. Anyone who is willing to learn something new can benefit.

This is a critical piece of data in understanding the market. These are measurable forces at work.
Read 5 tweets

Did Thread Reader help you today?

Support us! We are indie developers!


This site is made by just two indie developers on a laptop doing marketing, support and development! Read more about the story.

Become a Premium Member ($3/month or $30/year) and get exclusive features!

Become Premium

Don't want to be a Premium member but still want to support us?

Make a small donation by buying us coffee ($5) or help with server cost ($10)

Donate via Paypal

Or Donate anonymously using crypto!

Ethereum

0xfe58350B80634f60Fa6Dc149a72b4DFbc17D341E copy

Bitcoin

3ATGMxNzCUFzxpMCHL5sWSt4DVtS8UqXpi copy

Thank you for your support!

Follow Us!

:(