
What is Inside Bar ?
IB candlestick and its strategy !
A thread🧵
IB candlestick and its strategy !
A thread🧵

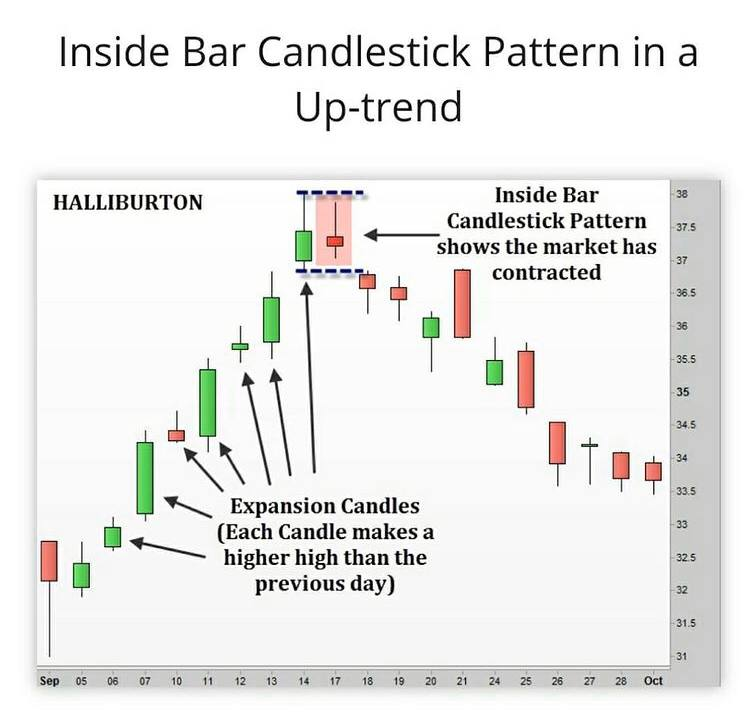
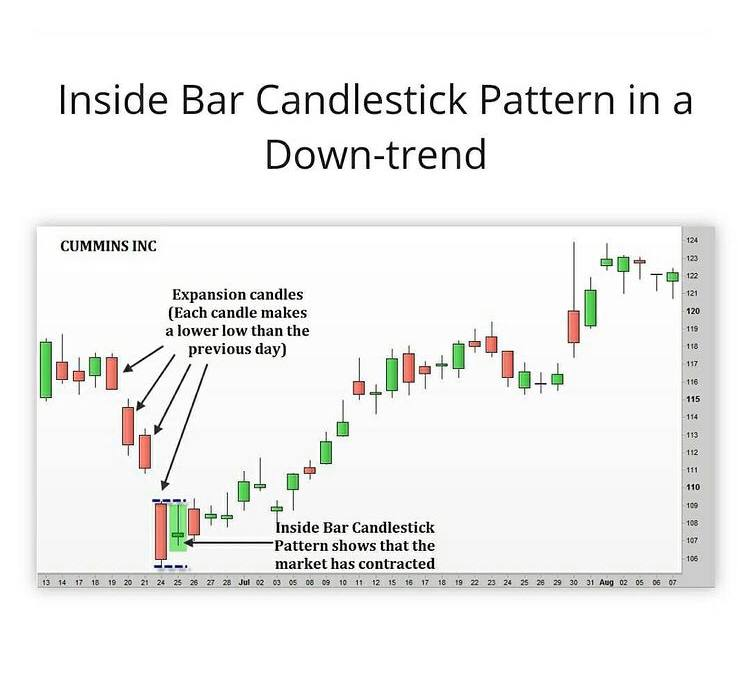
What is the Inside Bar Pattern?
The inside bar pattern is a one candlestick pattern where price forms completely within the previous candlestick.
For an IB to be considered valid both the high and the low of the
candlestick or need to be completely inside the previous candle
2/n
The inside bar pattern is a one candlestick pattern where price forms completely within the previous candlestick.
For an IB to be considered valid both the high and the low of the
candlestick or need to be completely inside the previous candle
2/n
There is often confusion around the wicks or shadows of the candlesticks
NOTE : the inside bar takes into account the candlestick wicks.
This means that the high and low, including the wicks of the candle must be within the high and low of the previous candlestick.
3/n
NOTE : the inside bar takes into account the candlestick wicks.
This means that the high and low, including the wicks of the candle must be within the high and low of the previous candlestick.
3/n
Is the Inside Bar Bullish or Bearish?
The inside bar is an indecision candlestick pattern.
The inside bar is formed because price was not able to break either the high or the low of the previous session.
4/n
The inside bar is an indecision candlestick pattern.
The inside bar is formed because price was not able to break either the high or the low of the previous session.
4/n


A Trend continuation Pattern
1. If an inside bar forms in a strong trend, for example a trend higher, then it could be signalling a quick pause before price continues on with the trend.
2. It simply means some Volatilty contraction and hence price moving in small range .
5/n
1. If an inside bar forms in a strong trend, for example a trend higher, then it could be signalling a quick pause before price continues on with the trend.
2. It simply means some Volatilty contraction and hence price moving in small range .
5/n
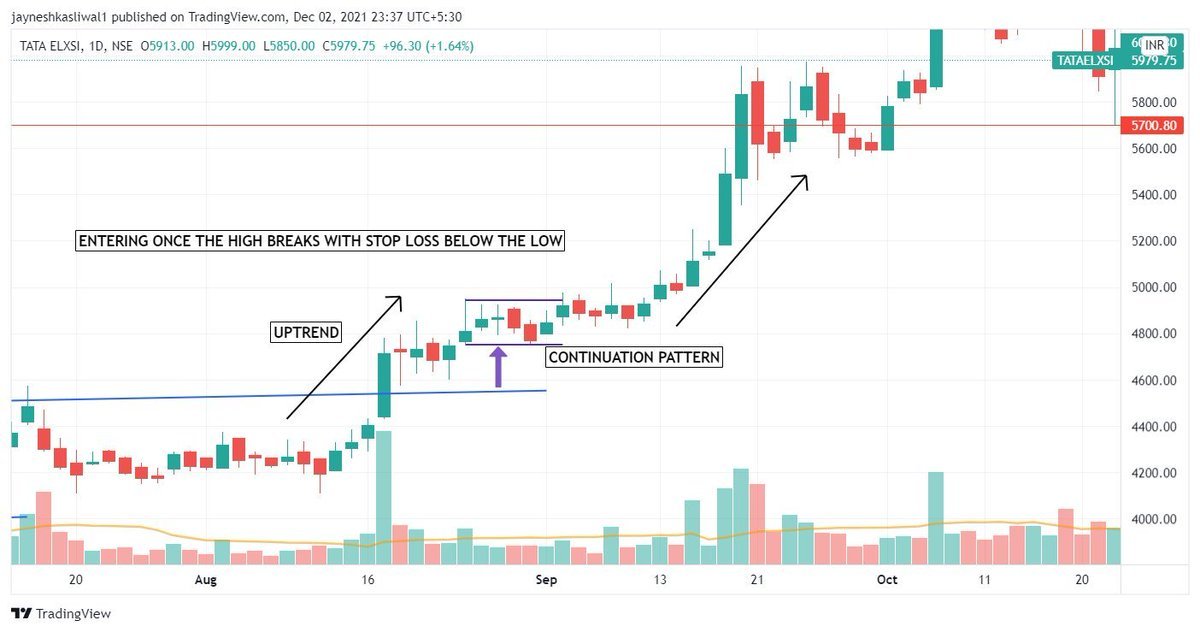
Because there is a strong trend, the inside bar represents a pause in the price action
When looking to enter with the inside bar breakout you are looking to enter when the signal confirms itself. This happens when price breaks the IB high or
low in the direction of the trend.
6/n
When looking to enter with the inside bar breakout you are looking to enter when the signal confirms itself. This happens when price breaks the IB high or
low in the direction of the trend.
6/n
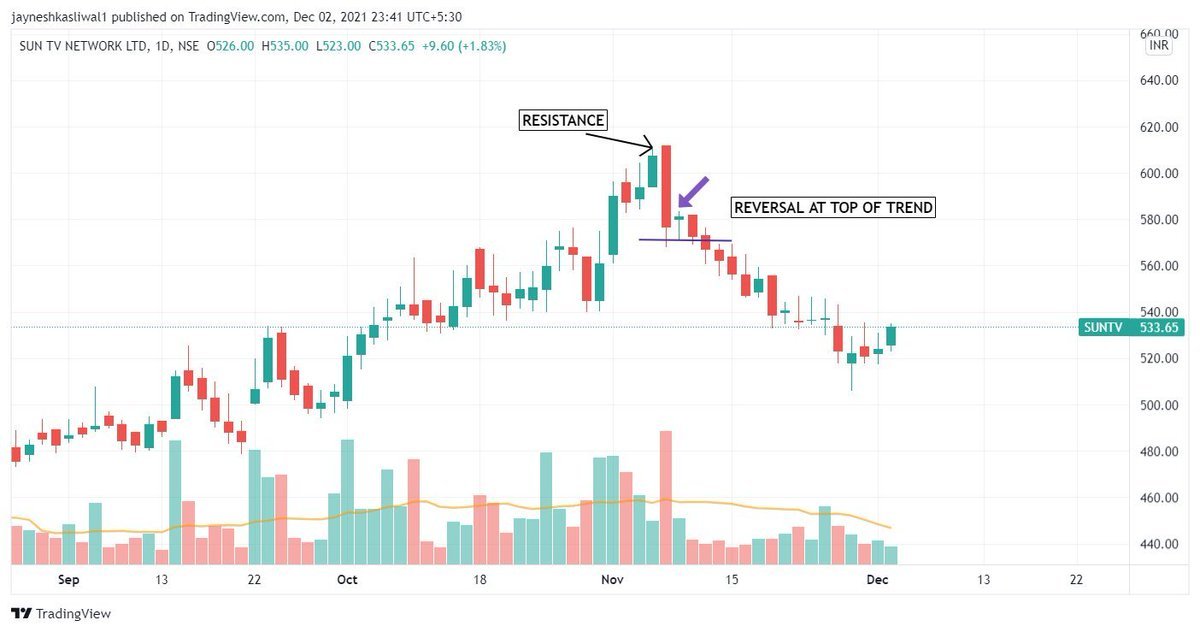
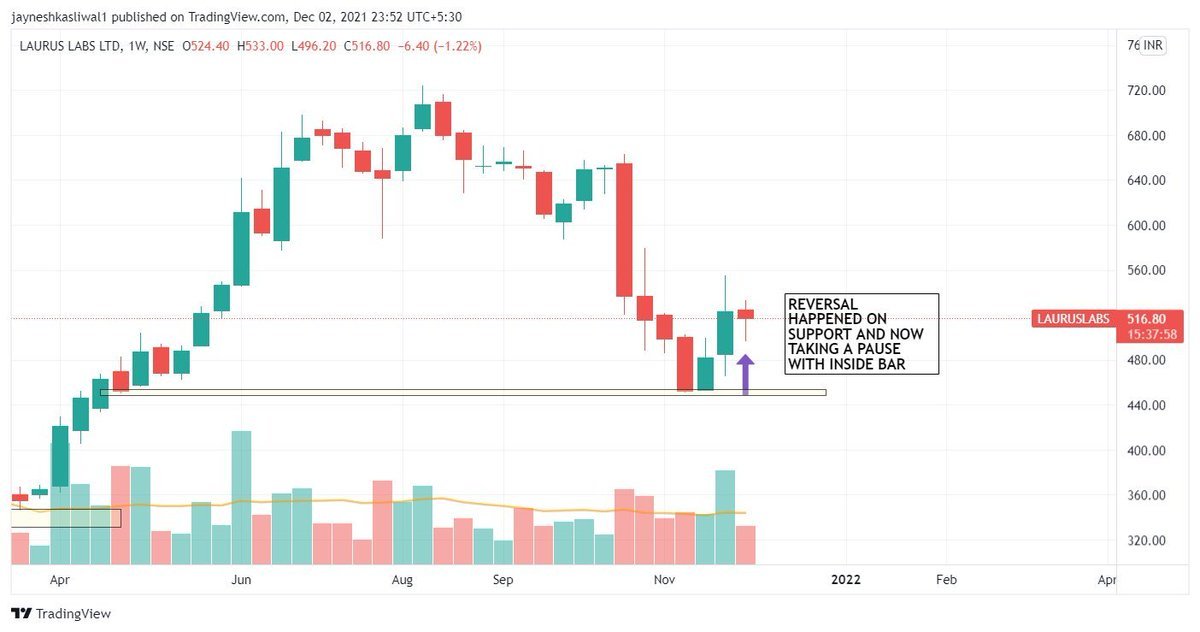
A Reversal Pattern
If an inside bar forms at a swing point and major support or resistance area, then it
can mean a change of trend and can be confirmed after a the low of Mother candle is broken
7/n
If an inside bar forms at a swing point and major support or resistance area, then it
can mean a change of trend and can be confirmed after a the low of Mother candle is broken
7/n
Where to trade and what time frame ?
Reversal Work best on inside bar on daily time frame and breakouts on weekly time frame (My observation)
Its important not to trade each and every IB as this could lead to poor trades.
Always better to have other confirmations of your own
8/n
Reversal Work best on inside bar on daily time frame and breakouts on weekly time frame (My observation)
Its important not to trade each and every IB as this could lead to poor trades.
Always better to have other confirmations of your own
8/n

Hi , guys planning to conduct
𝗦𝘄𝗶𝗻𝗴 𝗧𝗿𝗮𝗱𝗶𝗻𝗴 𝗠𝗲𝗻𝘁𝗼𝗿𝘀𝗵𝗶𝗽 :
4 Day Weekend course covering Stage Analysis , Relative strength , Stock Selection and Stock Screeners
Dm to know more details wa.link/si4jn4 Payment Link : bit.ly/MayMentorship
𝗦𝘄𝗶𝗻𝗴 𝗧𝗿𝗮𝗱𝗶𝗻𝗴 𝗠𝗲𝗻𝘁𝗼𝗿𝘀𝗵𝗶𝗽 :
4 Day Weekend course covering Stage Analysis , Relative strength , Stock Selection and Stock Screeners
Dm to know more details wa.link/si4jn4 Payment Link : bit.ly/MayMentorship

Time Frames to check
You can find this on all time frames from monthly to 1 minute chart .
The higher the time frame the better.
PowerOfstocks Sir Famously trades Banknifty on 15 min with inside bar.
You should practise minimum 100 trades on same time frame to checl results
9/n
You can find this on all time frames from monthly to 1 minute chart .
The higher the time frame the better.
PowerOfstocks Sir Famously trades Banknifty on 15 min with inside bar.
You should practise minimum 100 trades on same time frame to checl results
9/n
Telegram Link : t.me/Techno_charts
Join Trinkerr for Paper Trading in Options and get 10L
Join me now trin.kr/TechnoCharts_
Join Trinkerr for Paper Trading in Options and get 10L
Join me now trin.kr/TechnoCharts_
• • •
Missing some Tweet in this thread? You can try to
force a refresh


