1. This thread demonstrates one of the chief arguments of #TheEfficacyIllusion. I begin with the great work by @profnfenton and his colleagues, then add a dash of something cooked up by Miracle Max, who knows a thing or two about subdivided categories...
2. Before I get on to what I found while replicating Fenton's work, some readers may want to check out Fenton's simulation, here:
wherearethenumbers.substack.com/p/the-illusion…
wherearethenumbers.substack.com/p/the-illusion…
3. Those who learn better from videos may want to jump straight here:
4. For spreadsheet jocks and serious data minds, Fenton's argument is relatively simple. However, he is working with enough columns that I worry that those (even data trained) individuals held up with cognitive dissonance will simply ignore it. 

5. So, I set out thinking about how I might display the argument more simply in book form. Not only do I believe that I've found a way, but after replicating Fenton's work, I realized a way to engineer the full claimed VE of the experimental quasi-vaccines!
6. For the simplicity of a printed book, I decided to see how few columns I could work with to make Fenton's point. I also decided to use color differently, and it will soon be apparent why.

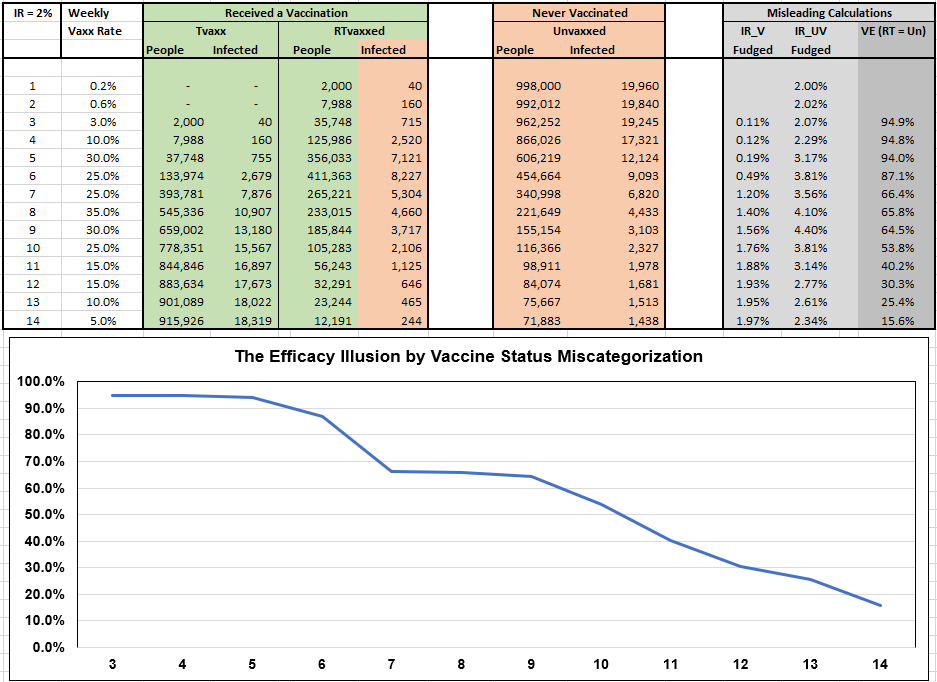
7. I use the same numbers Fenton uses:
* The 2% infection rate is irrelevant to the final calculations.
* The 1,000,000 population total (vaxxed + unvaxxed each week) does not change the proportions in those calculations either, but it's a nice, round number.
* The 2% infection rate is irrelevant to the final calculations.
* The 1,000,000 population total (vaxxed + unvaxxed each week) does not change the proportions in those calculations either, but it's a nice, round number.
8. I used Fenton's weekly vaccination rate curve (the proportion of the unvaccinated from the prior week that became vaccinated on any given week). I'll come back to this because alteration of that column becomes important!
9. Otherwise, I have the vaccinated population in green, and the unvaccinated in some pinkish skin pigment color because I didn't want to fiddle long enough to make it light red. You can check to see that 2% of the "People" in each group, each week, becomes "Infected".
10. Here is the setup for the sleight-of-hand: We break the Vaxxed cohort into two groups:
The RTvaxxed are those "Recently Treated" of the Vaxxed population, meaning in the past two weeks.
The Tvaxxed are those among the Vaxxed population "Treated" prior to two weeks ago.
The RTvaxxed are those "Recently Treated" of the Vaxxed population, meaning in the past two weeks.
The Tvaxxed are those among the Vaxxed population "Treated" prior to two weeks ago.

11. Now, step into the shoes of a sociopathic vaccine salesman. You want your product to look good, so you look for a reason to slough some infecteds off from the Vaxxed population into the Unvaxxed cohort.

12. Since it takes a little while for antibodies to build up (since people know these have something to do with immunity something something), you identify those infecteds in the RTvaxxed population, and miscategorize them as "Unvaxxed".

13. Recoloring one column to set up the trick:

14. Only now do you calculate VE. This involves calculating the infection rates for the Vaxxed and Unvaxxed cohorts. This is where the illusion takes place.

15. The RTvaxxed Infected population has been shifted from the numerator of the Vaxxed infection rate to the Unvaxxed infection rate, while the number of RTvaxxed has been kept in the denominator of the Vaxxed infection rate.
16. Let's demonstrate this illusion one time, for Week 3:

17. Now, instead of computing Zero VE as we should for a saline solution, we compute a fudged VE that allows for the military-pharma complex to pretend that transfection of cells with a foreign protein somehow resulted in fewer people becoming infected.

18. Wowzers and holy moly! We didn't even have to define what the population was being infected by, but the saline solution sure did protect people from it. People are going to be lining up for miles for these saline solutions.
19. Heck, let's sell them as "protection from infection by mortality" generally, or maybe "protection from infection by [the other political party]." I feel my bank account swelling, already!
Chicks dig ski slopes of gold...
Chicks dig ski slopes of gold...

20. Okay, now that my visions of a personal gold rush are over, let's expand the chart just a little to show that we have exactly the VE computations that Fenton & Friends came up with:

21. Much efficacy! So waning…
Now, you might have noticed that our illusion only ratched VE up to 86.3%. I thought at first that #HealthyUserBias (HUB) might further push VE up to the touted 95%.
Now, you might have noticed that our illusion only ratched VE up to 86.3%. I thought at first that #HealthyUserBias (HUB) might further push VE up to the touted 95%.
22. But as I played with the variables in the spreadsheet, I found some additional magic. One second, let me pull out my bag of faerie powdered mushroom dust and sprinkle it around the Weekly Vaxx Rate…a little here…a little there…
23. Behold! a miracle! With a few strokes of a keyboard, and a little pill concocted by a funny actor, we engineered 95% efficacy out of a saline solution!
24. Ladies and gentlemen...
25. Here is my writeup, though I plan to add to this exploration soon.
roundingtheearth.substack.com/p/adding-to-fe…
roundingtheearth.substack.com/p/adding-to-fe…

26. Note that none of this disputes that #HealthyUserBias confounds the CDC data sets.
https://twitter.com/EduEngineer/status/1621431031067811841?s=20
@Jikkyleaks @joshg99 @JesslovesMJK @MartinNeil9 @welcometheeagle @uTobian @I_Am_JohnCullen @WogPogReal @HousatonicLive @EWoodhouse7 @ClareCraigPath @RealGeorgeWebb1 @sasha_latypova @TheLiamSturgess @btysonmd @IamBrookJackson @thevivafrei @PierreKory @Wezuwezu @GeorgeFareed2… twitter.com/i/web/status/1…
@JamesOKeefeIII @DrJBhattacharya @conspiracymill @thedukereport @TheChiefNerd @UngaTheGreat @teacher_choice @FedsFoundation @canceledmouse @denisrancourt @veryvirology @bryan_caplan @lifebiomedguru @KLVeritas @GirardotMarc @JohnBeaudoinSr
@franklin_reeder @raoult_didier @tombyrer @P_McCulloughMD @elonmusk @OpenVAERS @DowdEdward @RichardGage_911 @rikirikiroo @Parsifaler @BusyDrT @zerohedge @WeaponizedNews @ChildrensHD
• • •
Missing some Tweet in this thread? You can try to
force a refresh