I'll tweet out some of the highlights from the report for those too lazy to download it.
Above: total stock of #gold above ground is about 209,000t.
Below, the value of this stock.
Note that there are substantial quantities of OTC #gold derivative positions that are not included in this total as this information is not readily or reliably available.
I find this graphic to be very useful when setting the scene about #gold demand.
It demonstrates the diversity of demand and shows the relative strength of the categories (10-year averages).
And this grpahic shows the diversity of supply.
(not the bubbles are only approximately scaled - we couldn't get Europe into any sensible sized bubble as it's production is so tiny).
Finally, #gold's proportion of Global Central Bank reserves is shown on this graphic.
Our #gold primers are a growing source of background information on the gold market and can be accessed on Goldhub here:
We've (obviously) noticed the divergence between #gold and the TIPS yield as its been going on for a while.
I beleive that this relationship, which has worked very well since the run-up to the GFC may have fundamentally changed...
It's hard to be sure but the dollar did open a little firmer than Friday's close.
Could the sell-off have been a 'fat finger' or something malicious? Either are possible.
But its also possible that #gold slipped lower as the dollar firmed, triggering stop-loss selling, which caused gold to slip lower, triggering more stops until the selling was exhaused.
Gold hit a new all-time high this morning, posting $1944.71/oz during late Asian trading and is currently near that level.
There has been a LOT of coverage of the all-time-high on social media – who knew there were so many #gold experts?😃😃
It’s great timing as far as we are concerned, as it means that #gold is getting a lot of attention ahead of the launch of our Q2-2020 / H1-2020 #GoldDemandTrends release, which will come out on Thursday.
What can we say about #gold at the moment? Obviously I am not going to front run the release of GDT, but we can repeat themes we’ve been making for some time.
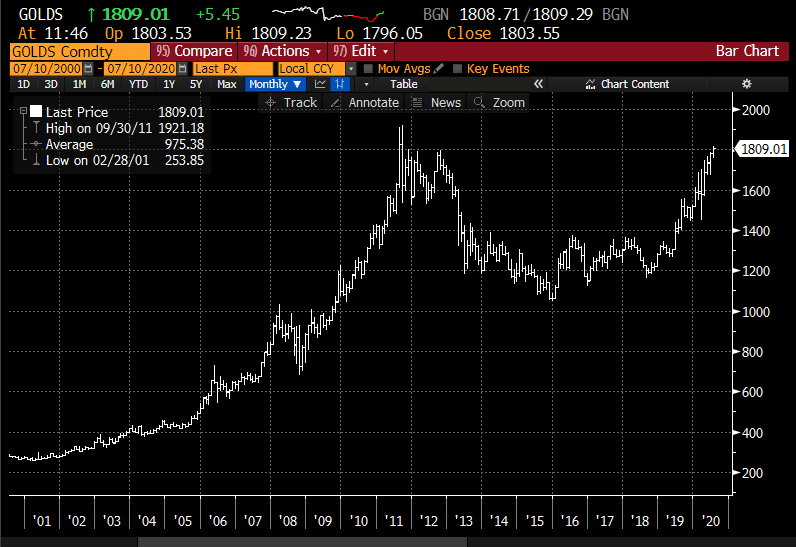
Gold is trading just above $1800/oz after hitting a fresh 8-year high this week. Not much appears to stand in the way of #gold challenging the all-time high of $1921/oz set in September 2011.
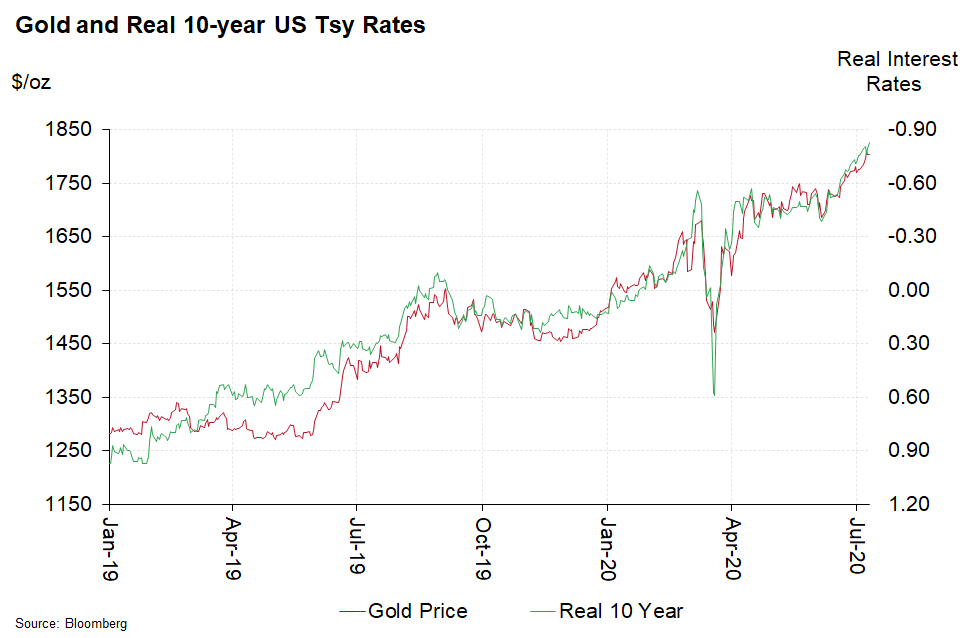
The best financial market-related explainer of the move in #gold is ever-falling real US yields and this relationship remains extremely important.
As concerns about the impact of the Coronvirus intensify, real rates have headed every lower, helping gold.
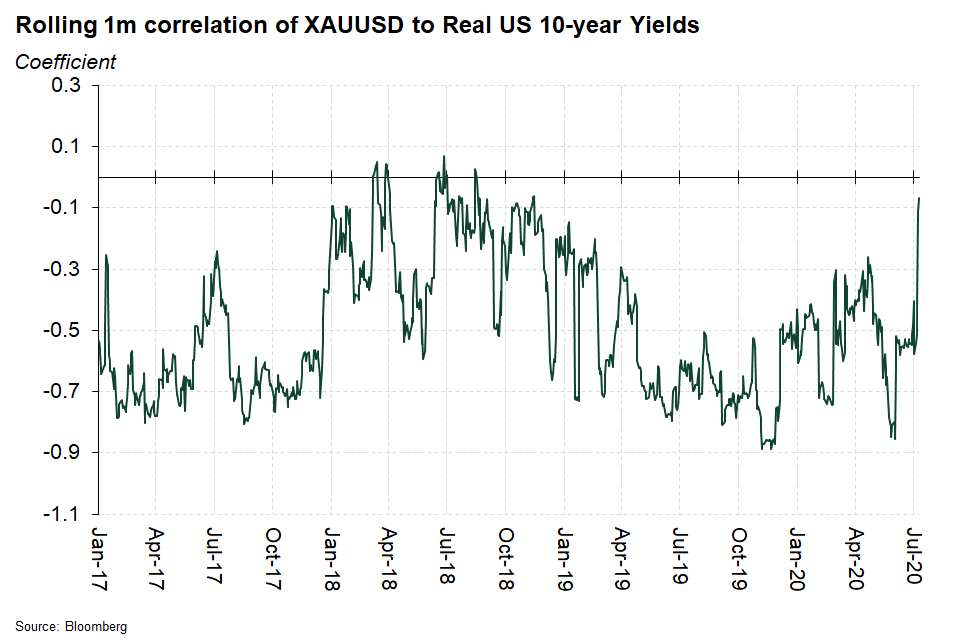
(Although interestingly the correlation of real rates and #gold has weakened sharply over the past month as this chart shows)
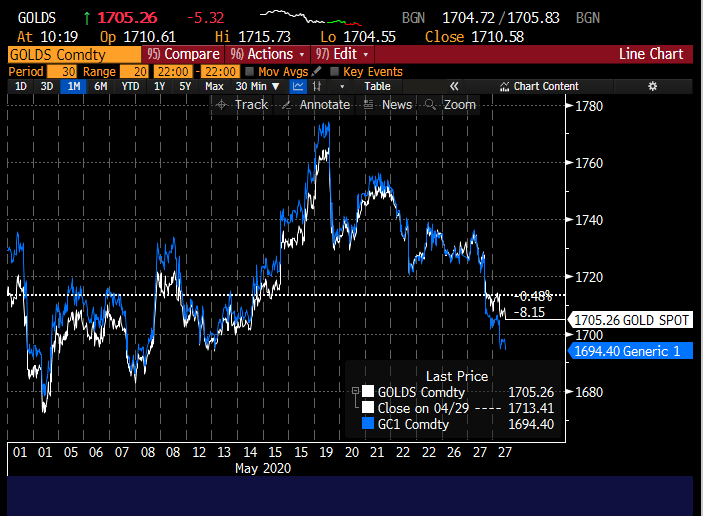
What a ride it has been for GCM0, the June-expiry Comex #gold contract.
One month ago it was trading at a $15/oz premium to the spot gold price.
Now it's trading at a $10/oz discount.
(short thread)
I’ve had a few questions this morning about
“why is the Comex future trading at a discount to spot”
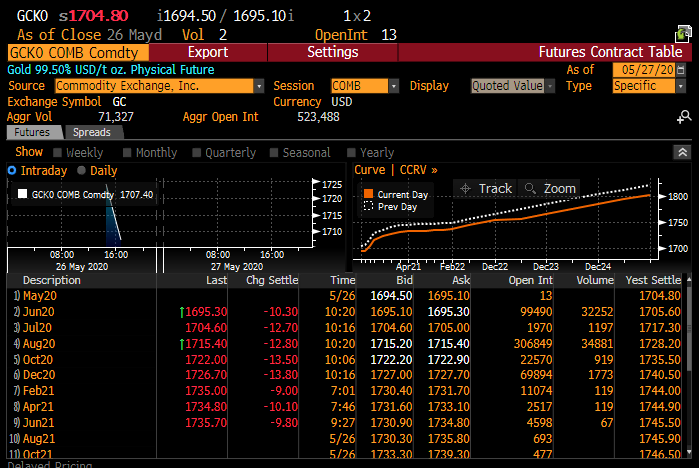
The short answer is that we are nearing first notice for Jun, so specs and investors are selling Jun and buying August.
This is pushing the Jun lower, hence the discount.
This screenshot of the contract table shows that much of the aggregate open interest has been rolled into August, but there is still nearly 100k lots left (as of 26 May).