Recent study present an analysis of “the gap between the CO2 storage required to meet net zero targets and the slow maturation of regional storage resources.”
Researchers estimate that “European storage rates need to boost 30-100x by 2030 to meet #NetZero by 2050. 🇨🇳 & North America face a similar challenge. The slow global progress of #CarbonStorage undermines the latest IPCC, IEA & EU transition pathways to net zero by 2050.”
2/12
Here, scientists of this study investigate “if sufficient #storage can be developed in time. China 🇨🇳 (30%), (15%) and Europe 🇪🇺(10%) dominate global #emissions.”
In this study, “Europe was chosen as a data-rich exemplar.”
4/12
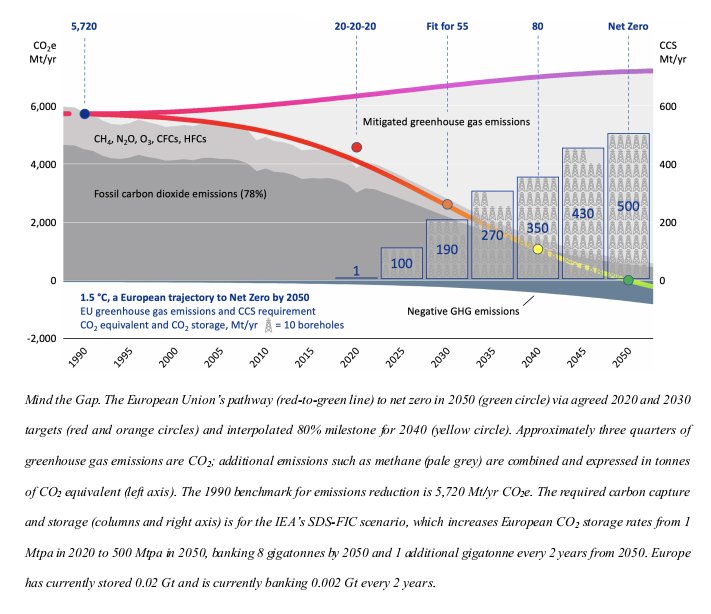
“Assuming #NetZero in 2050, researchers back-calculate the #storage required under 3️⃣ scenarios of low, medium, and high #CCS demand.”
5/12
“Even the low demand scenario requires 0.2 Gt of #storage by 2030, increasing to 1.3 Gt by 2050. The moderate & high demand scenarios require 5-8 Gt by 2050. The current #CarbonStorage rate in #Europe is 0.001 Gt/yr.”
6/12
So, “there is a huge gap btw policy demand & #storage supply. Adaptation of existing #hydrocarbon tech has the potential to close this gap, with CCS for the entire EU requiring less than half the historic rate of HC exploration & development in UK North Sea from 1980-2010.”
7/12
“Counter to expectation, #storage cannot be delivered by exponential growth but requires an early & sustained investment of 30-50 boreholes per year starting before 2030 to build sufficient capacity,” researchers affirmed.
8/12
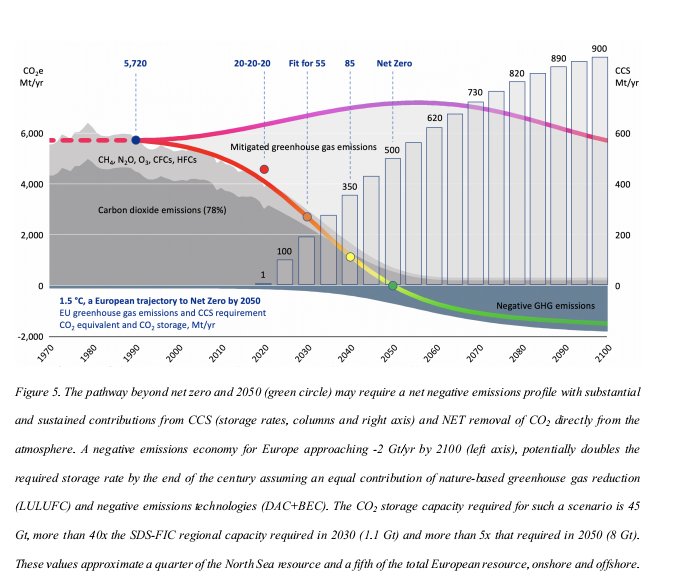
“A 5-year lead-time to identify & mature prospects needs policy intervention before 2025. Continued policy deferral will lock Europe into a low CCS pathway that restricts the contribution of #NETs at a potential cost of €100 billion for every gigatonne delayed beyond 2050.”
9/12
According to this research, “North America & China require similar policy intervention to close the gap on #CarbonStorage and #NetZero.”
10/12
To get more information on the research entitled: "Mind the gap: will slow progress on carbon dioxide storage undermine net zero by 2050?" (Preprint) visit ⬇️
📖📝➡️eartharxiv.org/repository/vie…
🚨🗞️Monthly Solar Geoengineering Updates (November Edition)
From the U.S. stratospheric-cooling patent to Global South funding, cautious UK–EU stances, tipping-point modeling & a surge in chemtrail chatter, #SRM captured global attention.
Top 10 SRM Highlights (Nov 2025)🧵1/6:
➡️@MakeSunsets secures its first US patent for stratospheric cooling tech
➡️Climate scientists remain skeptical of SRM, favor research over deployment, per @SZ (Garman newspaper) survey
➡️Royal Society sees SRM’s potential but stresses it can't solve climate change alone
🧵2/
➡️London Protocol reiterates precaution on marine geoengineering deployment
➡️UK reiterates it is “not in favor” of SRM deployment but open to debating regulation
➡️Studies warn SAI may cut protein in staple crops & destabilize yields for coffee, cacao & wine
🚨A new modeling study finds Stratospheric Aerosol Injection (#SAI) could lower risks to many of Earth’s #TippingPoints, but not all.
High-latitude deployment best protects ice sheets & permafrost, while low-latitude deployment favors rainforests & coral reefs.
DETAILS🧵1/14
2/ Tipping elements are highly sensitive to warming.
This study analyzes how different SAI designs (equatorial, mid-latitude, high-latitude & multi-objective strategy) influence the drivers of these tipping systems under SSP2-4.5.
3/ Across most tipping elements, SAI decreases risk relative to continued warming, but magnitude & direction of response are strongly pattern-dependent.
CO₂-driven warming & SAI-driven cooling aren't climatic mirror images - SAI can over- or under-compensate regional changes
🚨New study reveals a major hidden C sink in the deep ocean: ancient talus breccias - piles of broken basalt formed along seafloor faults - can trap & store CO₂ for tens of millions of years, potentially offsetting a significant share of mid-ocean ridge emissions.
DETAILS🧵1/10
2/ Researchers made the discovery while drilling 60-million-year-old seafloor in the South Atlantic.
They found talus breccias containing ~7.5 wt% CO₂ - the highest carbon content ever measured in upper ocean crust, up to *40 times richer than previously sampled basalts.
3/ Why so much C?
These breccias form when steep faults at slow-spreading ridges collapse, creating piles of fractured rock with high natural porosity (~19%).
Over millions of yrs, cold seawater circulates thru rubble & precipitates carbonate minerals, trapping dissolved CO₂
🚨Soil food webs boost carbon retention in farmlands
A new study reveals that simply returning crop residues to fields can supercharge soil food webs, enabling microbes, nematodes & fungi to lock significantly more photosynthetic C into farmland soils.
Details🧵1/8 #CarbonSink
2/ Researchers from the Institute of Applied Ecology, Chinese Academy of Sciences (CAS), used field trials and ¹³C isotope tracing to map how carbon fixed by crops travels into soil and through the soil food web.
3/ FINDINGS:
Returning crop residues (stover) emerged as a key driver:
It increased particulate organic carbon (POC) by ~30.96% & mineral-associated organic carbon (MAOC) by ~11.39% compared with plots where stover was removed.
🚨New research shows how integrating Direct Air Capture (#DAC) with urea production - paired with CO₂ pricing can slash emissions, reach cost parity with fossil-based urea by 2050 & reshape global fertiliser markets through policies like the EU #CBAM.
DETAILS🧵1/9 #CDR
2/ What DAC-urea is?
It's urea fertilizer made with CO₂ pulled directly from the air instead of CO₂ from fossil fuels.
Air-captured CO₂ + green ammonia → urea.
Same fertilizer, but far lower climate impact.
3/Study presents a framework combining process modelling, prospective LCA & TEA to compare DAC-urea with conventional fossil-based urea today & under 2050 climate scenarios, including a cross-country assessment of Denmark’s clean electricity system & Egypt’s more C-intensive grid
Our “Carbon Removal Updates Newsletter” community keeps growing, now past 𝟰,𝟬𝟬𝟬 subscribers across every continent. We’ve delivered 146+ weekly CDR updates & reached 𝟱𝟬𝟬,𝟬𝟬𝟬+ total views.
🧵1/10
2/ 𝗚𝗹𝗼𝗯𝗮𝗹 𝗥𝗲𝗮𝗰𝗵
🇺🇸United States: 33% (largest share of subscribers)
🇬🇧 United Kingdom: 13% & 🇩🇪Germany: 8% lead our European readership
🇮🇳 India: 5% tops the Asia-Pacific region
🇨🇦 Canada: 5% represents a significant share of our North American audience
3/ 🇺🇸𝗨𝗦 𝗥𝗲𝗴𝗶𝗼𝗻𝗮𝗹 𝗛𝗶𝗴𝗵𝗹𝗶𝗴𝗵𝘁𝘀
Our U.S. readership is concentrated in major climate and innovation hubs: