This was on track to happen next month but we're here already. #ResolvePM is the first Voice poll to have the Yes vote below 50% forced choice. (49-51, down 4).
There is also a 42-40 lead for Yes with undecided allowed (which I suggest the forced choice Q shows to be meaningless).
Don't agree with this wording (doubt it makes much difference): Voting yes/no is not compulsory (at least not enforceably); participation is. As previously noted informal vote has been negligible in referendums in recent decades but cannot be sure it will be so this time. 

Note that the state figures are an amalgamation of two months' data in which the average forced-choice Yes vote would have been around 51. So Resolve also has a merged sample with Yes ahead overall but losing 3 states (however most polls have had SA ahead of nat avge).
State samples in all specific polls should be treated with high caution, especially when combined sample sizes are modest. For this, aggregation across multiple pollsters is necessary for serious commentary.
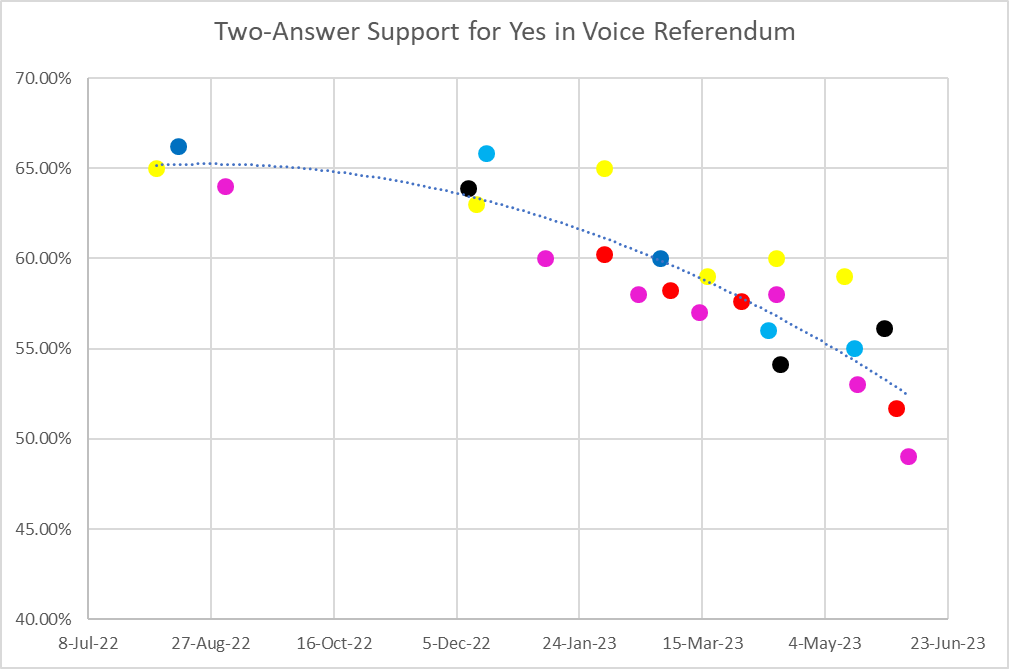
All (non-rejected) polls graph (2-answer preferred with forced choice prioritised) is now again looking like accelerating decline. However Resolve which seems to be the worst poll for Yes has most recent reading and Essential which seems the best lacks recent data. 

So while that graph is suggesting Yes at only 52.5 I think a model that assumed there could be house differences between pollsters would have it slightly higher.
This. Unprecedented things can happen (several did in 2022 federal election) but if Yes wins it will revolutionise understanding of how referendums pass (and probably how to poll them), while if No wins history will have seen it all before.
https://twitter.com/mumbletwits/status/1668130439444451328
• • •
Missing some Tweet in this thread? You can try to
force a refresh

 Read on Twitter


