
Thread: Let us be clear -- the work of Gabriel Zucman should be taken with a major/huge grain of salt. Largely because he and his colleagues have been sloppy as hell. I will not mince words here and list the litany of sloppiness #econtwitter
https://twitter.com/gabriel_zucman/status/1669349694739476481
First, you have to understand the following thing: the work of Zucman with Piketty and Saez (henceforth PSZ) builds heavily on a 2003 paper in QJE. I revisited the data, assumptions and methods of that paper in two published papers -- one at Economic Inquiry and the other at EJ
Without that paper, the others dont follow. Its the essential building block and changing stuff to it changes the other papers (on optimal taxation, on progressivity, on wealth inequality)
Let me also explain that when I started those papers with @PhilWMagness in 2016, I assumed we were simply improving a data series. However, the more I delved into the details and archives the more I realized that there was immense sloppiness.
And I am going to focus pre-1960 because David Splinter and Gerald Auten showed far more serious problems post-1960 than those I show pre-1960. PS simply assume that income reported in the IRS publications. davidsplinter.com/AutenSplinter-…
Okay lets start with the data quality itself. Until WW2, income was self-reported in the USA at the federal level. The result was that income was underreported in tax filings. However. what is less known is that the underreporting was far more important in lower income classes
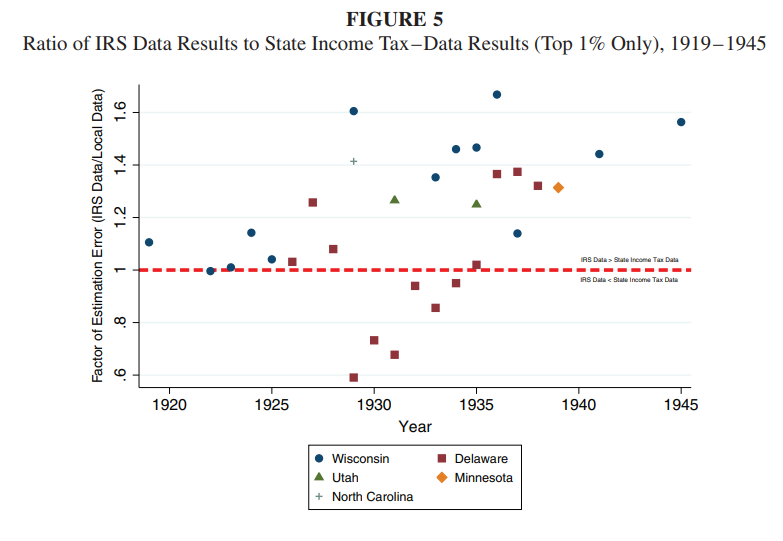
@PhilWMagness and I noted that there had been tons of articles in top 5 journals during the 1940-1970 period that used state-income tax systems to create state-level estimates. So we checked if those reported similar income as IRS.
They didnt. Not. By. A. Long. Shot (see bottom two graphs). They reported more income and proportionally more in lower income classes. 

The reason why is that the IRS audited higher-incomes more than lower-incomes. So, reporting is higher quality near the top.
We used two states (Wisconsin and Delaware) that had aggressive enforcement systems across the income distribution. When we did so, we found inequality levels sometimes more than 5 points below (for the top 1%) than PS.


But not to be lazy, we asked -- okay, what if Delaware and Wisconsin were just oddballs. What if we use ALL the states we can find. Again...same...pattern. The IRS data overstates inequality.

Overall, on average, the IRS data is 1.18 greater than the correct data and that number is low because we arent even questioning their assumptions. Graph below shows extent of overstatment by IRS.
At no point -- in the 2003 paper or since -- have PSZ considered that their data may be weak. No efforts to document limitations of the data due to incentives.
That could be shrugged off. But here comes methodology and assumptions. This is where you can see insane amounts of sloppiness (no other way to call it). Here is the laundry list.
First: There is a need to adjust for missing fillers because often less than X% (X=fractile of choice, 10,5,1 etc.) of tax units filled a tax report. They make an adjustment based on labor market in 1942 arguing that there is a IRS sample that allows them to.
Two things: 1942 is a war year and the adjustment is going to be war-distorted. Second, in the same source that they use, there is mention of another dataset that is larger, greater quality and for 1941 tax year. Far fewer distortions and better.
Simply shifting to 1941 affects alot. Enough to knock off a point for the top 10% income share pre-1940.
Second: Pre-1943, the IRS reports data in net income. So there is a clear need to adjust into gross. PS simply made arbitrary assumptions that they called reasonable and did not detail (which you can only find in their excel file...in French (which I speak))

However, the assumptions are WAY too liberal. Even if you accounted ALL DEDUCTIONS from IRS and compared them with the implied deductions (no assumptions on distribution across classes of income), the implied gross income of PS is nearly always greater than the total gross of IRS

Moreover, in the same sources that they use, the IRS provides enough data to create adjustments to convert net into gross at the income class level. When you do that, you knock off an extra few points

Third: PS then go on to poo-poo Simon Kuznets' work on the income denominator for estimating inequality but they forgot to notice that he spends considerable time in his NBER book on how state and local government employees didnt have to file taxes pre-1939.

This matters since they grow from roughly 2% of emplyoment to 5% of employment and their payroll seems to grow faster still. It knocks roughly 1-2 points of the top 10% income share. This is just from not reading the history sources properly.
Fourth, they have to create an income denominator to divide the top incomes by. To do so they assume its 80% of personal income (NIPA) minus transfers. However, they do four big mistakes.
4a) they didnt notice that Hawaii and Alaska are included in the IRS data but not in NIPA. Thus, numerator and denominator have different coverage. Small error, but still sloppy.
4b) They justify creating their denominators rather than connecting with Simon Kuznets's. To do so, they poo-poo Kuznets by pointing out that his method means that non-filers in 1948 had higher incomes than filers. Implausible they say.
4b-cont) but that is true only for 1948. For all other years, Kuznets does not have that problem.


4c) They say they use 80% of Personal income minus transfers because its pretty much the post-war figures. It is not! Not even close.

4c-cont) In fact, its nearly always above 80% -- and that is from their own datasheets! The difference from 80% to 82.7% may seem small. However, it still knocks an extra 1.35 percentage points for the top 10%.

4d) Then they say they use the assumption that non-fillers had 20% of the income of fillers to create the denominator post-1943. But that is not what they do. They use different proportions that they never explain and dont match their appendix descriptions.

So, Phil and I simply decided that it was better to build our income denominator from scratch by using the BEA guidelines to create an income denominator that definitionally consistent with the IRS gross income figures. We did it line-by-line and year-by-year (a year of work)
This denominators brings us between the Kuznets estimates and PS estimates. But it knocks off between 3 and 6 percentage points of the top 10% income share and 0.5 to 2 points off the top 1%.

You also end up with a massively different trend where most of the levelling in inequality is during the depression not WW2.

Now notice that we are still *understating* the extent of problems. Our first article dealing with data quality cannot be mixed with our second article regarding methodology without making some heroic assumptions that would give huge error bars.
But we know that the methodological errors that led PS to overstate inequality must be added to the data quality problems of the IRS. So the red line is probably lower still than what we depict.

Okay, you can poo-poo me now and say "who cares, Vincent". I do! I care about data being treated with respect and that historical sources should be mishandled.
I do believe that my corrections suggest that inequality was dealt with more due to the depression than due to tax policy changes in the 1940s. It fits with the Walter Scheidel story that catastrophes tend to be the most effective levelers.
But even if you dont agree -- you cannot be sloppy with the data. I spend hours and days documenting ALL my data choices in all my papers and I share my data so people can criticize me.
But its more than that, you have to be self-critical and wonder if you are working in ways that you make you see what YOU want to see. Am I getting the results I want because of the way I do it or are these the real results?
And you should also bear in mind that I am not the only one point this out. Gerald Auten and David Splinter have shown other issues with the treatment of the data, the choice of units for households/tax units and income definitions. davidsplinter.com/AutenSplinter-…

Mechling et al. have shown that their data choices are allowing tax reforms from the 1986 to drive the results purely out of tax-accounting reasons. Once you correct, you find that trough of inequality is higher (such that post-1980 rise is smaller) tandfonline.com/doi/abs/10.108…

The amount of errors I highlighted above should make you think about the discount factor to place on the work of PSZ that build on PS 2003. Please take anything PSZ write with a ton of salt on it because I will not take their results at face value.
In fact, I am so skeptical of their work that if they told me they agreed with me, I would probably go back to redo my entire work once again just to make sure I didnt miss something important.
• • •
Missing some Tweet in this thread? You can try to
force a refresh


