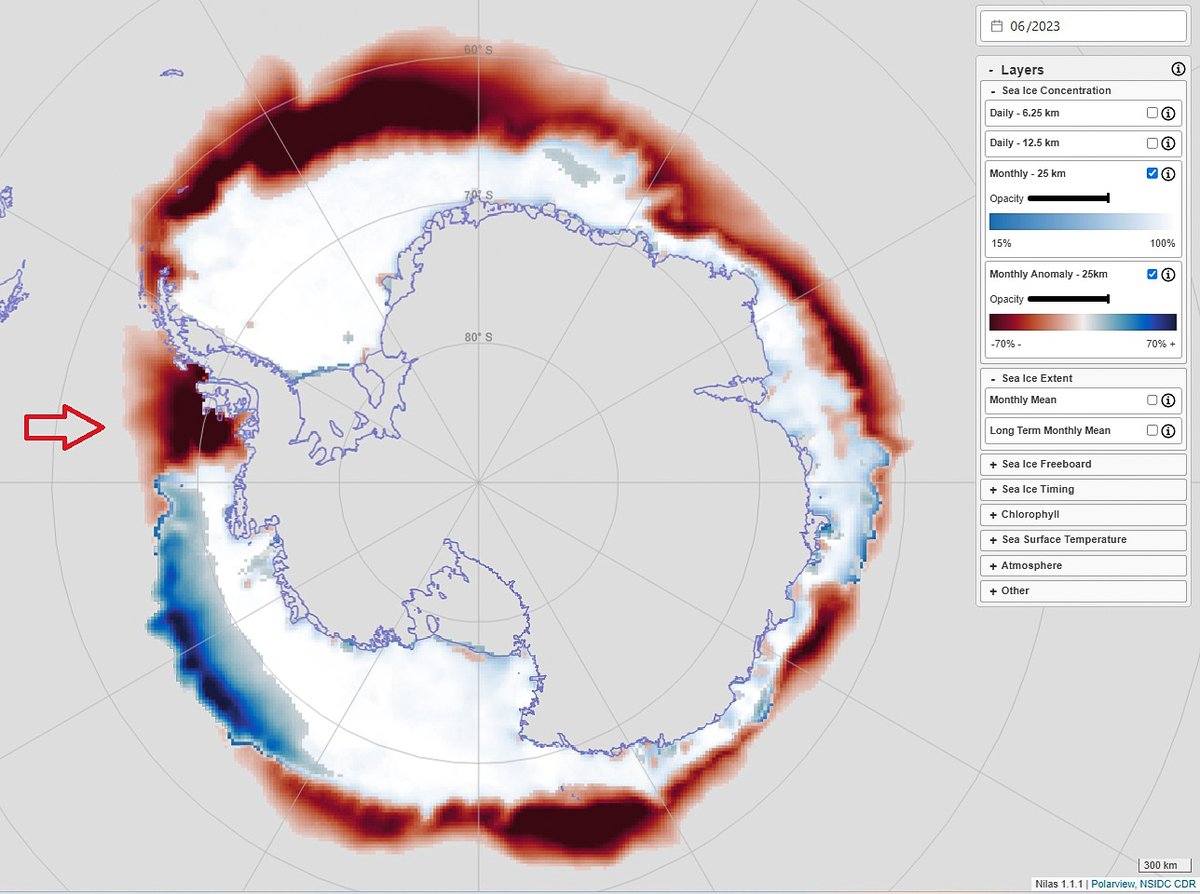
Anomalies in #Antarctic sea ice concentration show the monthly variation from the long-term mean. This map from nilas.org shows more ➖ than ➕ anomalies for June. See the lack of sea ice in Bellingshausen Sea (arrowed), almost at summer ice levels in mid-winter! Image
This map from @NSIDC and @NASAEarth shows sea ice concentration on 17 June. The orange line is the typical extent for that day based on the average from 1981 to 2010. Some coastal regions are now ice-free where that has not been observed before. Image
The last decade has seen increased variability. Sea-ice area reached a record low in Feb 2023 following the previous record low in Feb 2022, and an extremely low summer avg in 2016/17. Is this shift in Antarctic sea ice a response to climate change? We need to find out @IPCC_CH. graph: Will Hobbs, AAPP
⚠️ A statement of concern and a call for urgent intensification of research has been issued by @WMO.
Read at aappartnership.org.au/polar-scientis… photo: Ben Wallis
More info on Antarctic sea ice from @Ant_Partnership and @AntarcticSciAus ⤵️
aappartnership.org.au/science-briefi…
Stay in touch with our research on the role of #Antarctica and the @_SouthernOcean
in the global #climate system - please sign up to our mailing list at aappartnership.org.au/contact-us/. Next bulletin by end of June! Image

• • •

Missing some Tweet in this thread? You can try to force a refresh
 

Keep Current with Australian Antarctic Program Partnership

Australian Antarctic Program Partnership Profile picture

Stay in touch and get notified when new unrolls are available from this author!

Read all threads

This Thread may be Removed Anytime!

PDF

Twitter may remove this content at anytime! Save it as PDF for later use!

Try unrolling a thread yourself!

how to unroll video
  1. Follow @ThreadReaderApp to mention us!

  2. From a Twitter thread mention us with a keyword "unroll"
@threadreaderapp unroll

Practice here first or read more on our help page!

More from @Ant_Partnership

May 26
🧶 1/9
The massive currents swirling around Antarctica are a crucial driver of the global network of ocean currents that transport heat, carbon, oxygen and nutrients around the world. How will this lifeline change on a warming planet?
[animation: @NASAViz]
2/9
New research from @CSIRO, @AntarcticSciAus, @ccrc_unsw, @AucklandUni and AAPP shows the deep ocean currents in the Australian Antarctic Basin have slowed by approximately 30% over the past three decades, reducing oxygen levels in the deep ocean.
aappartnership.org.au/antarctic-deep…
3/9
Seawater freezes ➡️ rejects brine ➡️ dense cold salty oxygen-rich water sinks to form Antarctic Bottom Water (AABW) ➡️ pumps oxygen into the deep sea ➡️ ‘ventilates’ abyss 😲 while only forming in 4 locations, AABW fills the deepest 40% of the global ocean.
[graphic: @WHOI] Image
Read 9 tweets
May 24
Three great @AntarcticSciAus Research Associate positions in @UTAS_ Hobart: paleo ice-sheet modeller (closes 5 June); magnetotelluric geophysicist (closes 11 June); and ice-sheet modelling and data science (closes 26 June).
Please share and/or apply!
Details at links below 🔽
Read 4 tweets
May 9
🧵1/6
Each spring in the Southern Ocean, sometimes seen from space by @NASA satellites, swirling blooms of solar-powered phytoplankton turn CO2 into food for everything else. While we know the blooms are critical to the biological carbon pump, what triggers them is up for debate. NASA satellite view of Sout...
2/6
In #ASLO_Letters, researchers from @IMASUTAS, @ClimateExtremes, @CSIRO & @Ant_Partnership use chlorophyll, phytoplankton carbon & nitrate to understand the best indicator for the timing of blooms - the first study to look at all 3 at once.
➡️ doi.org/10.1002/lol2.1… @aslo_org Image
3/6
They use data from 7114 profiles from 56 BGC-Argo floats circling #Antarctica to measure the biogeochemistry of the Southern Ocean south of 60°S, like this by @SOCCOMProject. See how the @bgc_argo float rights itself in the water, ready to start a mission of at least 3 years.
Read 7 tweets
Apr 28
🫁 It’s like you can see the oceans breathing. As seasons change, chlorophyll levels from tiny marine plants ripple around the planet. Phytoplankton use chlorophyll to absorb carbon dioxide to make food. This @NASA map gives insights to the oceanic carbon cycle. Read on...🧵
2/7
🔃 Crucial for ocean carbon cycling is the 'biological pump', where carbon is taken from the atmosphere by life and put into storage in the deep. It turns out that tiny phytoplankton in the @_SouthernOcean play an outsized role in stopping the planet from overheating. Microscopic phytoplankton (...
3/7
🌊 The Southern Ocean is central to slowing the rate of global heating. It accounts for about 40% of the ocean's annual absorption of human-made carbon! So to understand its role in global climate, we really need to understand the influence of biology on this carbon sink (C). Biological pump (graphic: S...
Read 8 tweets

Did Thread Reader help you today?

Support us! We are indie developers!


This site is made by just two indie developers on a laptop doing marketing, support and development! Read more about the story.

Become a Premium Member ($3/month or $30/year) and get exclusive features!

Become Premium

Don't want to be a Premium member but still want to support us?

Make a small donation by buying us coffee ($5) or help with server cost ($10)

Donate via Paypal

Or Donate anonymously using crypto!

Ethereum

0xfe58350B80634f60Fa6Dc149a72b4DFbc17D341E copy

Bitcoin

3ATGMxNzCUFzxpMCHL5sWSt4DVtS8UqXpi copy

Thank you for your support!

Follow Us on Twitter!

:(