
Refresher on Hemodynamics:
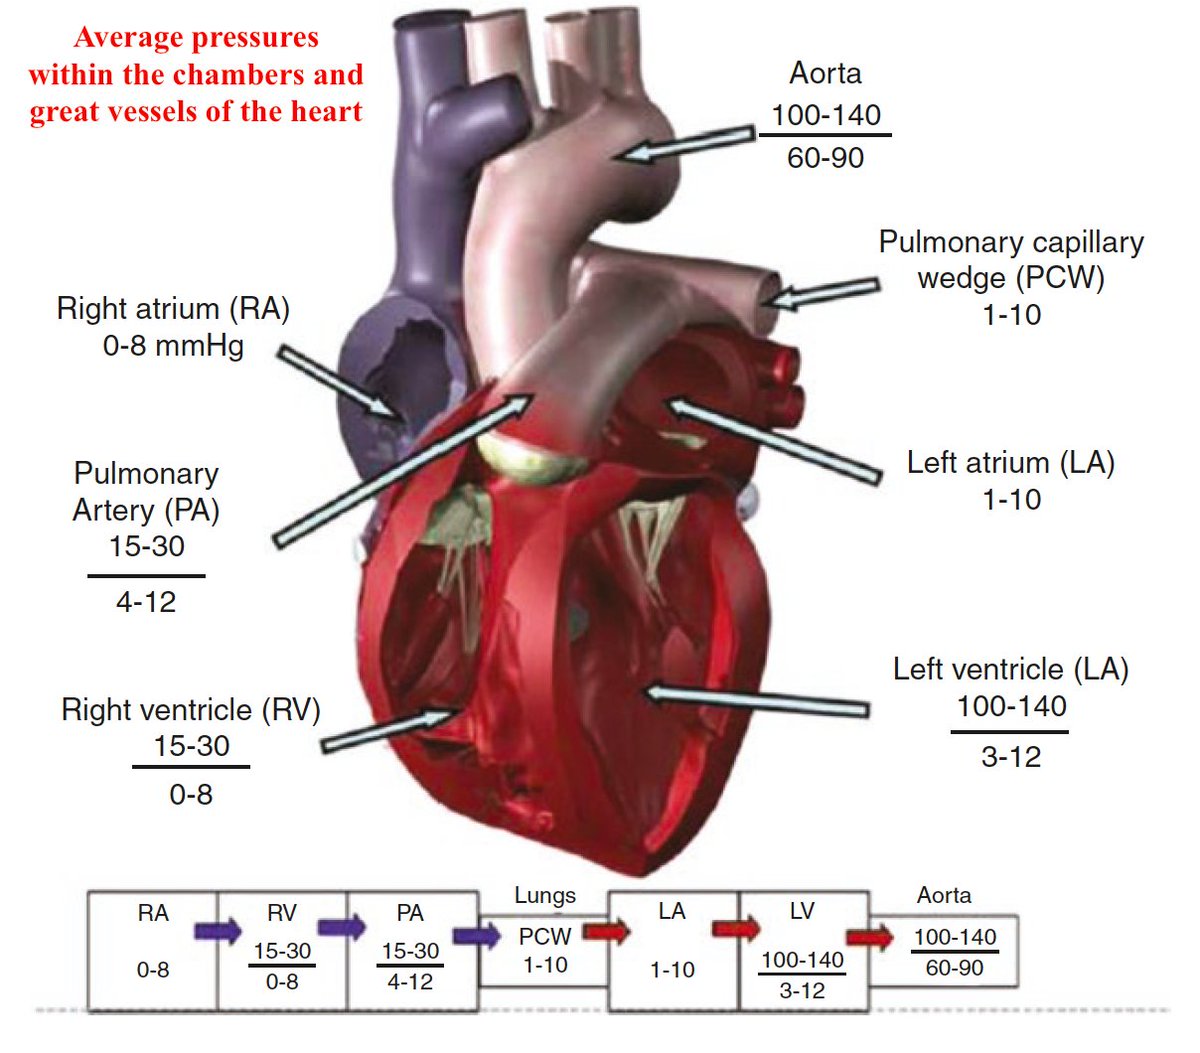
From: Cardiovascular Hemodynamics. An Introductory Guide. Arman T. Askari, Adrian W. Messerli. Springer International Publishing; 2019
From: Cardiovascular Hemodynamics. An Introductory Guide. Arman T. Askari, Adrian W. Messerli. Springer International Publishing; 2019
CVP waveform (note: there is generally an electromechanical delay of ~ 80 msec between the atrial depolarization of the P wave & the pressure deflection of atrial systole represented by the "a" wave)

Intracardiac pressure waveforms derived from the pulmonary artery catheter

Note that the “a” wave of LA contraction comes AFTER the ECG “P” wave & the “v” wave AFTER the ECG
“T” wave. The “v” FOLLOWING the “T” wave can help distinguishing a prominent “v” wave in wedge position from the systolic PA waveform, which occurs before the “T” wave
“T” wave. The “v” FOLLOWING the “T” wave can help distinguishing a prominent “v” wave in wedge position from the systolic PA waveform, which occurs before the “T” wave

There is usually a gradient of < 5 mmHg between the PA
diastolic pressure & the mean PCWP to ensure forward blood flow through the pulm vasculature. A wedge pressure that exceeds PAD suggests measurement error, such as misidentification of a dampened PA tracing or overwedging
diastolic pressure & the mean PCWP to ensure forward blood flow through the pulm vasculature. A wedge pressure that exceeds PAD suggests measurement error, such as misidentification of a dampened PA tracing or overwedging
The gold standard invasive clinical assessment of cardiac preload is the LV end-diastolic pressure (LVEDP), measured w a catheter retrogradely crossing the AoV into the LV. Although the PCWP is a good surrogate of LV preload, LVEDP was >5mmHg higher than PCWP in ~30% of heart pts
Situations where pulmonary capillary wedge pressure (PCWP) may inaccurately represent left ventricular end-diastolic pressure (LVEDP)

PV loop

Which of the following does not generally cause the wedge pressure to be unrepresentative of the LA pressure?
Overwedging, pulm venous hypertension, & atrial myxoma can all cause the wedge to be higher than the real LA pressure. Severe MR, MS and aortic regurgitation can also cause the wedge pressure to misrepresent the left ventricular end-diastolic pressure
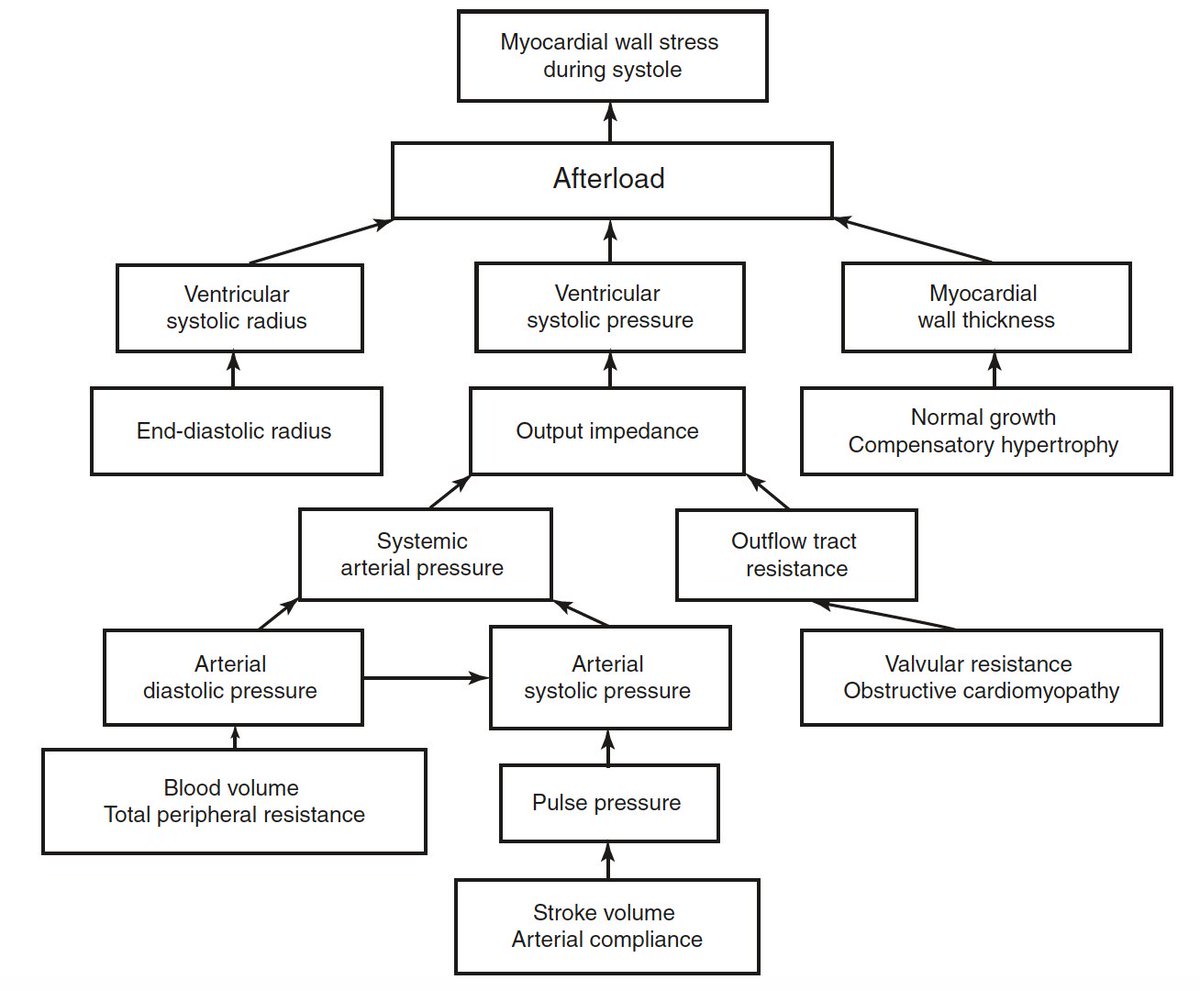
The LV wall tension can be described by Laplace’s equation:
σ = PR/2w
where: σ is wall stress, P is pressure, R is ventricular radius, and w is wall thickness
σ = PR/2w
where: σ is wall stress, P is pressure, R is ventricular radius, and w is wall thickness
This 👆 means that a given intra-ventricular pressure, a dilated LV (with increased ventricular radius) will have to develop a higher inward force than a smaller heart to generate the same systolic pressure
On the other hand, a hypertrophic LV will achieve a lower wall stress (increased denominator in Laplace's equation!) and more easily generate a systolic pressure that overcomes ventricular afterload
When the left ventricle shortens/contracts, it has to overcome not only "what happens" in the aorta but what happens throughout the arterial tree; this is the arterial impedance and its three major determinants are:
1. resistance
2. compliance
3. inertia
1. resistance
2. compliance
3. inertia
We tend to focus more on resistance which is described by the Poiseuille's equation:
R = 8 × η × l/πr4
where:
R is resistance, η is blood viscosity, l is vessel length, and r is vessel radius
R = 8 × η × l/πr4
where:
R is resistance, η is blood viscosity, l is vessel length, and r is vessel radius
As it can be seen, resistance is inversely proportional
to the fourth power of the radius. Therefore, small
changes in arteriolar diameter have profound effect on resistance
to the fourth power of the radius. Therefore, small
changes in arteriolar diameter have profound effect on resistance
Compliance is a property of the vascular wall. Highly compliant vessels are more distensible
Note #1: Elastance is the reciprocal of compliance
Note #2: Compliance is heart rate-dependent
Note #1: Elastance is the reciprocal of compliance
Note #2: Compliance is heart rate-dependent
Inertia is related to the mass of the blood column, and opposes the acceleration of the blood flow
Note: Inertia is heart-rate dependent
Note: Inertia is heart-rate dependent
An additional and usually ovelooked contributor to the afterload is the phenomenon of retrogradely reflected pressure waves traveling from the periphery back towards the left ventricle... 🤔
If the reflected wave arrives in the proximal aorta
within the same cardiac cycle,
If the reflected wave arrives in the proximal aorta
within the same cardiac cycle,
it will add up to the incident wave and both will contribute to the arterial waveform
When the reflected wave arrives during LV systole, it will increase the afterload. When it arrives during diastole, it will augment coronary blood flow (an intrinsic IABP effect?)
When the reflected wave arrives during LV systole, it will increase the afterload. When it arrives during diastole, it will augment coronary blood flow (an intrinsic IABP effect?)
The effects of wave reflection on the systolic pressure profile (Chirinos JA, Sweitzer N. Ventricular-arterial coupling in chronic heart failure. Card Fail Rev. 2017; 3: 12-8)

An ambitious attempt to depict factors determining afterload (Norton JM. Toward consistent definitions for preload and afterload. Adv Physiol Educ 2001; 25: 53-61)
Any attempt to bring the impedance concept as a clinically measurable tool at the bedside has been proven difficult and therefore we use the
much simpler mean aortic pressure or mean systolic
pressure as the best surrogate of afterload
much simpler mean aortic pressure or mean systolic
pressure as the best surrogate of afterload
I have left outside the refresher two phenomena because I ran out of coffee...
1. the fact that in a vascular system, pressure and flow do not always propagate in sync to each other...
2. the pressure recovery phenomenon...
1. the fact that in a vascular system, pressure and flow do not always propagate in sync to each other...
2. the pressure recovery phenomenon...
From all these mind-boggling concepts, I try to keep in mind that LV afterload is affected by:
i) the LV wall stress (Laplace's equation)
and
ii) the aortic impedance
i) the LV wall stress (Laplace's equation)
and
ii) the aortic impedance
But, understanding the relationship between the ventricle and its afterload is important in order to understand the #Medtwitter popular concept of ventriculo-arterial coupling. To this end, we have to go back to the PV loops
The effective arterial elastance (Ea) is the ability of the vessel to accept pulsatile flow & is calculated by dividing end-systolic pressure (ESP) by stroke volume (SV). End-systolic elastance (Ees), the slope of a line through the ESP-volume point, is a measure of contractility
The ratio of the Ea to the Ees represents a measure
of pump efficiency & can be used as reflection of the ventriculo-arterial coupling (VAC). Ventricular efficiency is maximal at Ea = Ees/2, meaning that the most favorable VAC occurs when the Ea/Ees ratio is in the range 0.5-1.0
of pump efficiency & can be used as reflection of the ventriculo-arterial coupling (VAC). Ventricular efficiency is maximal at Ea = Ees/2, meaning that the most favorable VAC occurs when the Ea/Ees ratio is in the range 0.5-1.0

• • •
Missing some Tweet in this thread? You can try to
force a refresh


