1/5 
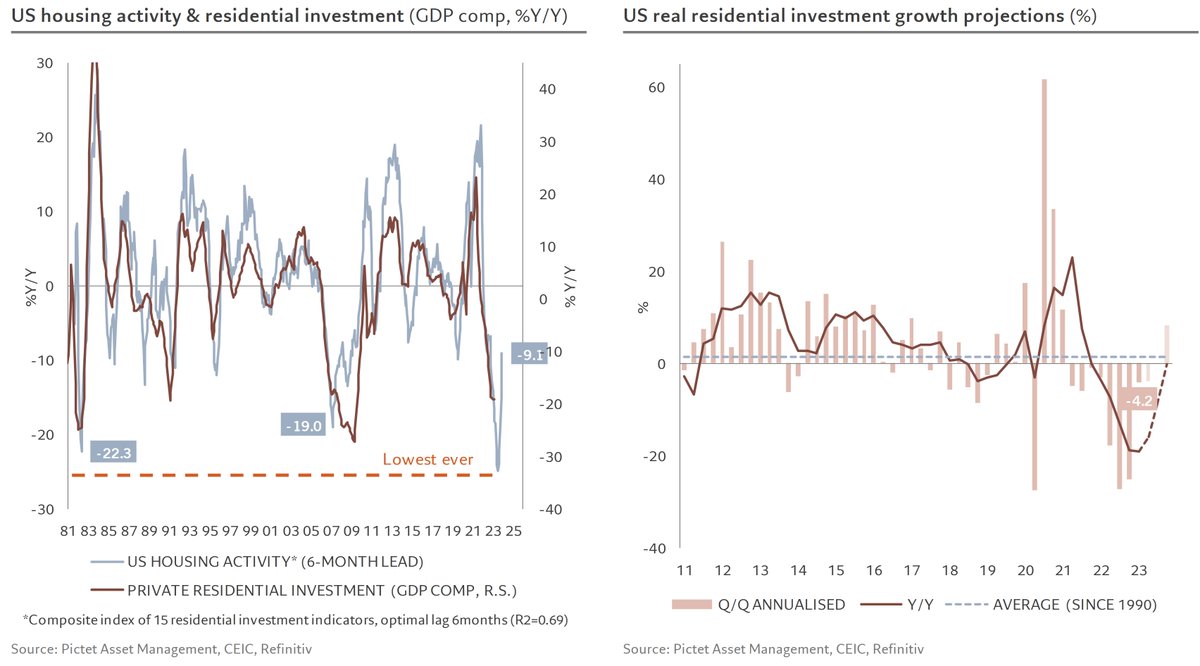
After 11 months of collapse, which took our #US housing activity indicator to its lowest point in over 10 years, it has rebounded for the 6th consecutive month, with 10 out of 15 components up, among which housing starts (+22% m/m !), …
2/5 … homebuilders’ sentiment up 5 points, in expansive territory for the first time in 11 months and median new home price to disposable income ratio which fell 15% since its peak, returning to its >20-year average
3/5 One of the implications of the rebound in our activity indicator is that the residential component of GDP should stop contributing negatively to growth as early as Q3, supporting the idea of a soft landing for the US
4/5 Another implication is that house prices have likely bottomed out
5/5 All in all, the US residential market has bottomed out, but the rebound should remain contained, with rates for new mortgages still high and debt servicing still at 26% of median income for the purchase of an existing home
• • •
Missing some Tweet in this thread? You can try to
force a refresh
1/ Chinese economic activity in May showed mixed results. The data points to a Q2 GDP nowcast of 4% q/q ann., indicating a slowdown from Q1 (5.9%) but a slight improvement from April's nowcast (3.6%)
2/ The positive surprise came from retail sales in China, which significantly rebounded after a slight contraction in April. This brought the six-month annualized growth to 10%, exceeding pre-pandemic average
While consumption was previously driven by service spending, this uptick in goods sales suggests a potential catch-up, although they still remain 13% below pre-pandemic levels
3/ Investments have slightly declined for the second consecutive month, bringing the six-month annualized growth rate to 8.1%, close to the pre-pandemic average
1/ US inflation came out lower than expected, up a tenth y/y on the headline at 2.4% and unchanged on the core at 2.8%. However, the shorter-term trend is clearly downwards, particularly over 6 months.
A few comments, however, one technical, the others macro
2/ The number of imputations from other items has seen a dramatic increase since Trump took office: from 9% to 30% in May - nearly twice as much as the worst month of COVID - attributed by the BLS to labor shortage.
This implies that the prices of 2333 items (30% of 7776) are no longer being collected and are being replaced by the price of the nearest item. This does not necessarily indicate a systematic bias in not reporting the highest increasing prices, but it remains concerning during a time when tariff transmission is under scrutiny and undermines confidence in CPI data
3/ The breakdown of core inflation shows that services inflation is normalizing, approaching its long-term average of 3.1%, while goods inflation continues to rise gradually.
1/ Chinese activity data for April slowed, with most indicators contracting. Our Q2 GDP nowcast shows 3.6% q/q ann. growth, down from 5.9% in Q1. With an average of 4.8% over the first two quarters, the slowdown isn't significant enough to trigger the anticipated fiscal response, especially after recent monetary support.
2/ On the supply side, industrial production remains 5% above pre-pandemic trends, with slowing growth but still around 7% annualized over the past six months.
3/ On the demand side, consumption is driven by services (quarterly data), while retail sales fell in April, reducing six-month growth to 5% and maintaining a gap of over 10% from the pre-pandemic trend
1/ Chinese activity in March exceeded expectations, providing strong momentum for the trade war with the US and reducing the urgency for fiscal support
GDP has returned above its pre-pandemic trend with two consecutive quarters of growth above potential: nearly 8% in Q4 2024 and 6% in Q1 2025
2/ On the supply side, industrial production has continued to drive activity, running 5% above its pre-pandemic trend and showing an annualized 6-month growth of 8.5%, which is 2 percentage points above its pre-2020 average
3/ External demand remained a strong support, with export volumes up over 11% y/y in Q1. However, US demand, which could have surged in anticipation of higher tariffs on Chinese goods, remained restrained
1/ After 2 months of better activity data in September and October, the gradual recovery continues into November. The main private demand indicators combined with PMI surveys show a recovery in our nowcast GDP growth in Q4 to 8.1% from 2% in Q3
2/ Industrial production remains solid, growing at an above-average rate of close to 9% over 3-month annualised, above its pre-pandemic trend
3/ For the 3rd month in a row, retail sales volumes rebounded from the disappointing summer months, bringing 3-month growth to over 14% annualized, but keeping the annual variation at less spectacular levels of around 3%
1/ Chinese activity data for June generally came in below expectations and slowed, as did GDP growth, which fell to 4% q/q ann. in Q2 from 6.6% in Q1. Taken together, these 2 quarters still point to growth in line with the Chinese authorities' target of around 5%.
2/ Retail sales volumes contributed to the slowdown, as they contracted in June, leading to a Q2 contraction of 0.9% q/q ann.
3/ That said, total consumer spending, which includes services, continues to be the main driver of Chinese activity, evolving only a few 2% below its pre-pandemic trend, with growth for the quarter of 4.8% ann., albeit decelerating sharply since Q1 (13%).