1/ VITAL🧵 So people have had a couple of days to digest the DDRBs "independent" reports & their imposition by governemnt.
TLDR;they represent further MASSIVE pay cuts.
Lets start with some history and look at what happened BEFORE the current high inflation
Pls read all/RT
TLDR;they represent further MASSIVE pay cuts.
Lets start with some history and look at what happened BEFORE the current high inflation
Pls read all/RT
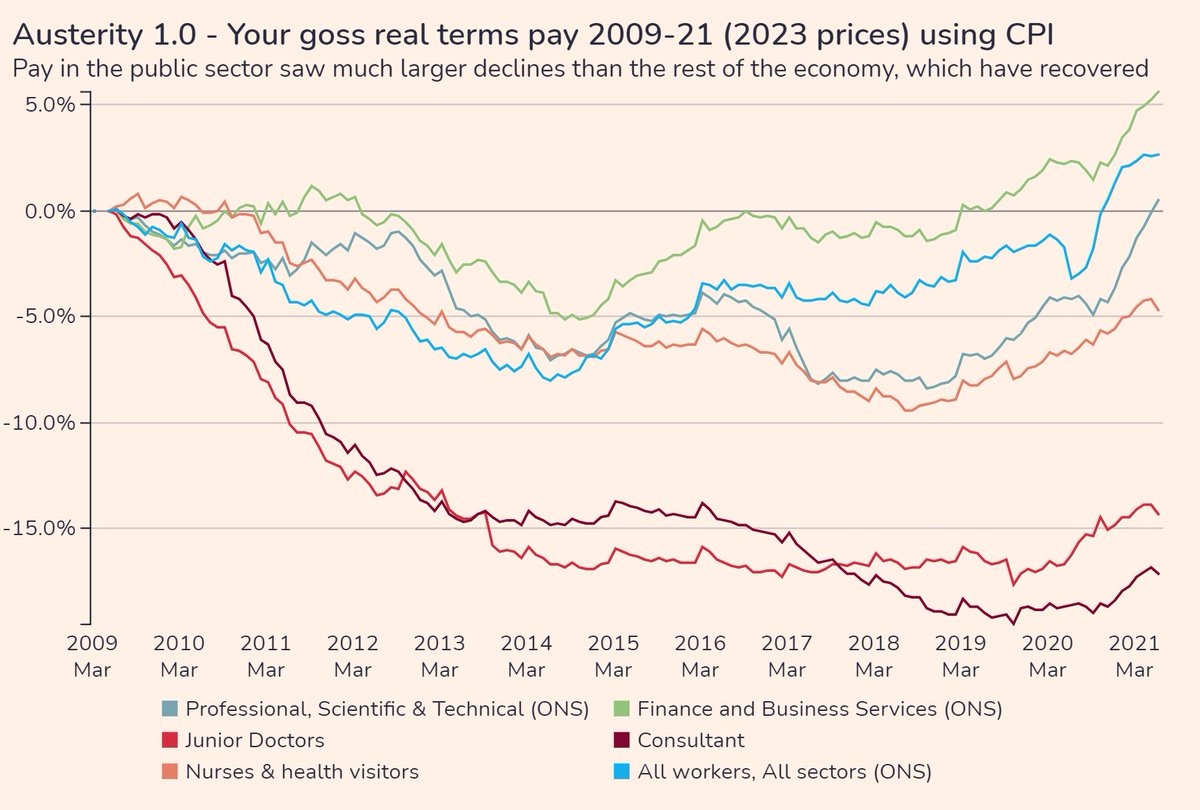
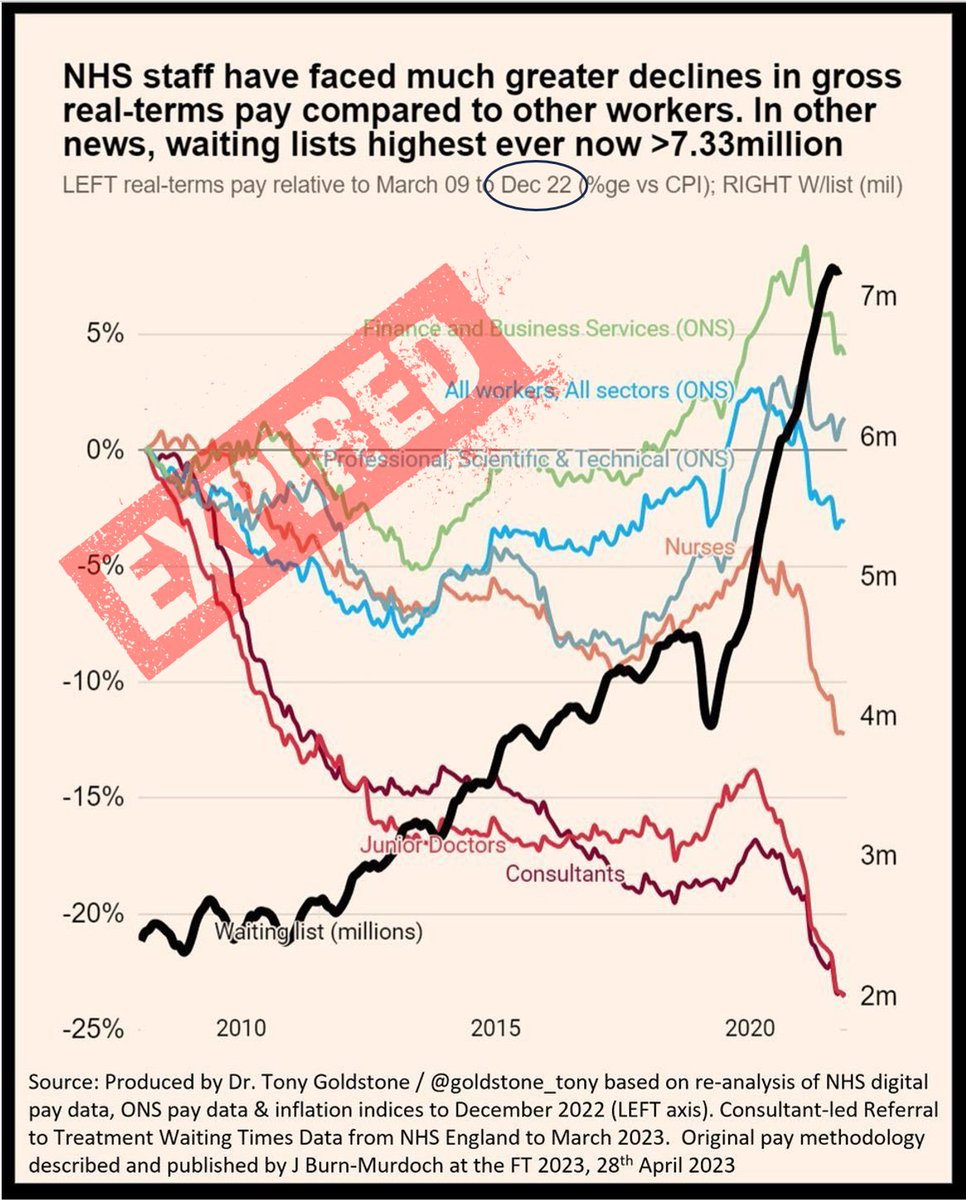
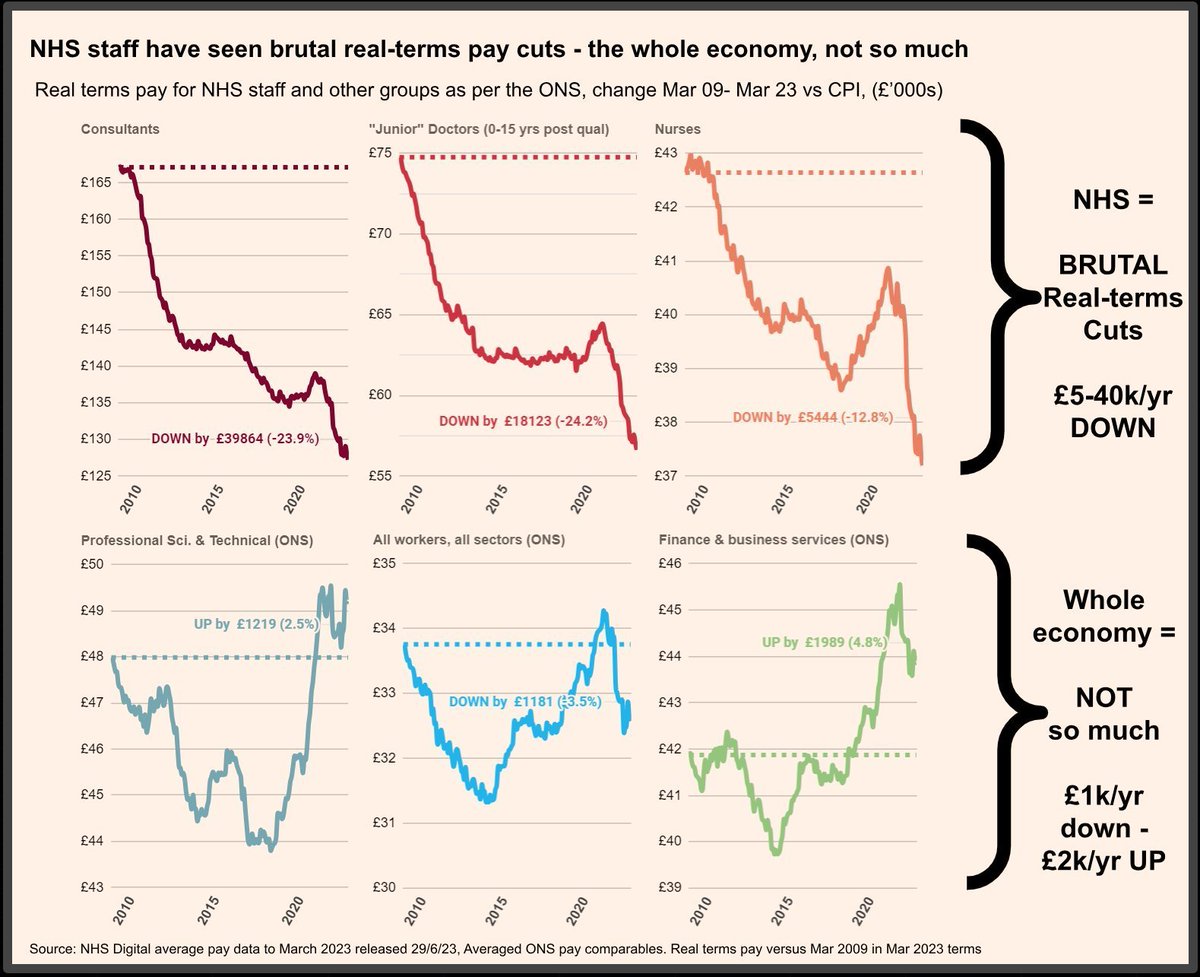
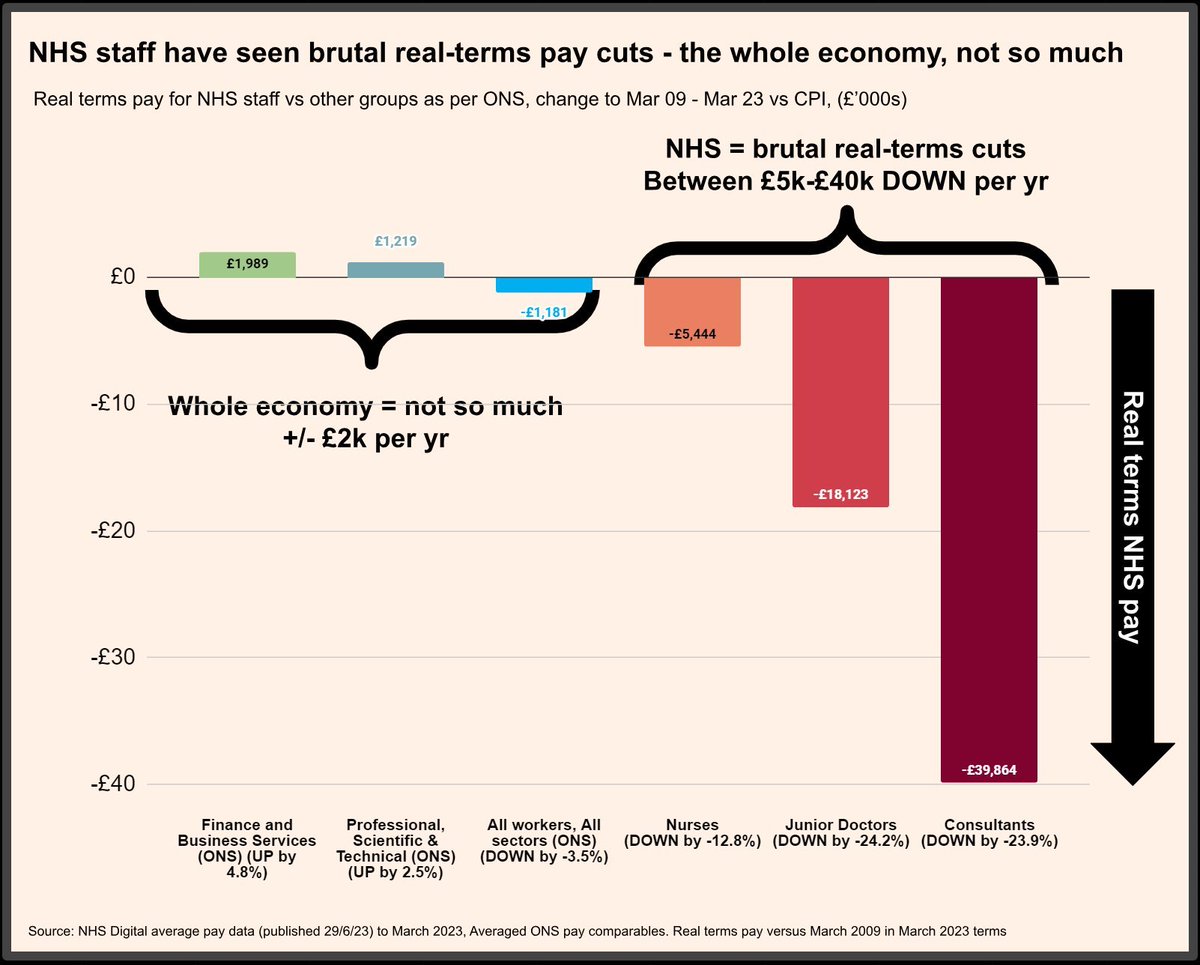
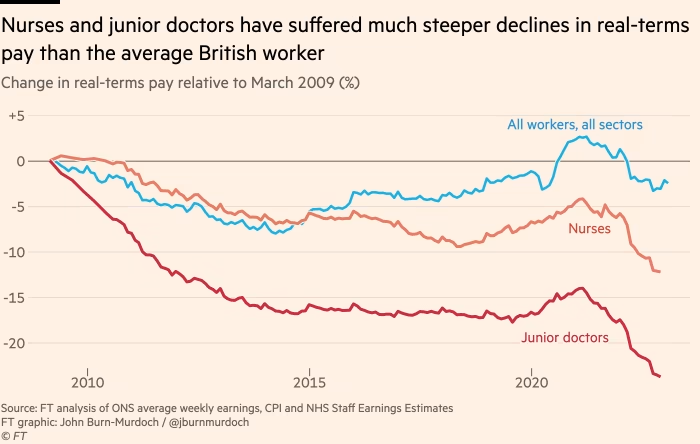
2/ Just before inflation started to bite "junior doctors" avg gross pay were some 14.3% below CPI (government preferred measure of inflation, RPI is much worse) and consultants down 17.1% vs CPI.
Lets call that "Austerity 1.0"
Lets call that "Austerity 1.0"
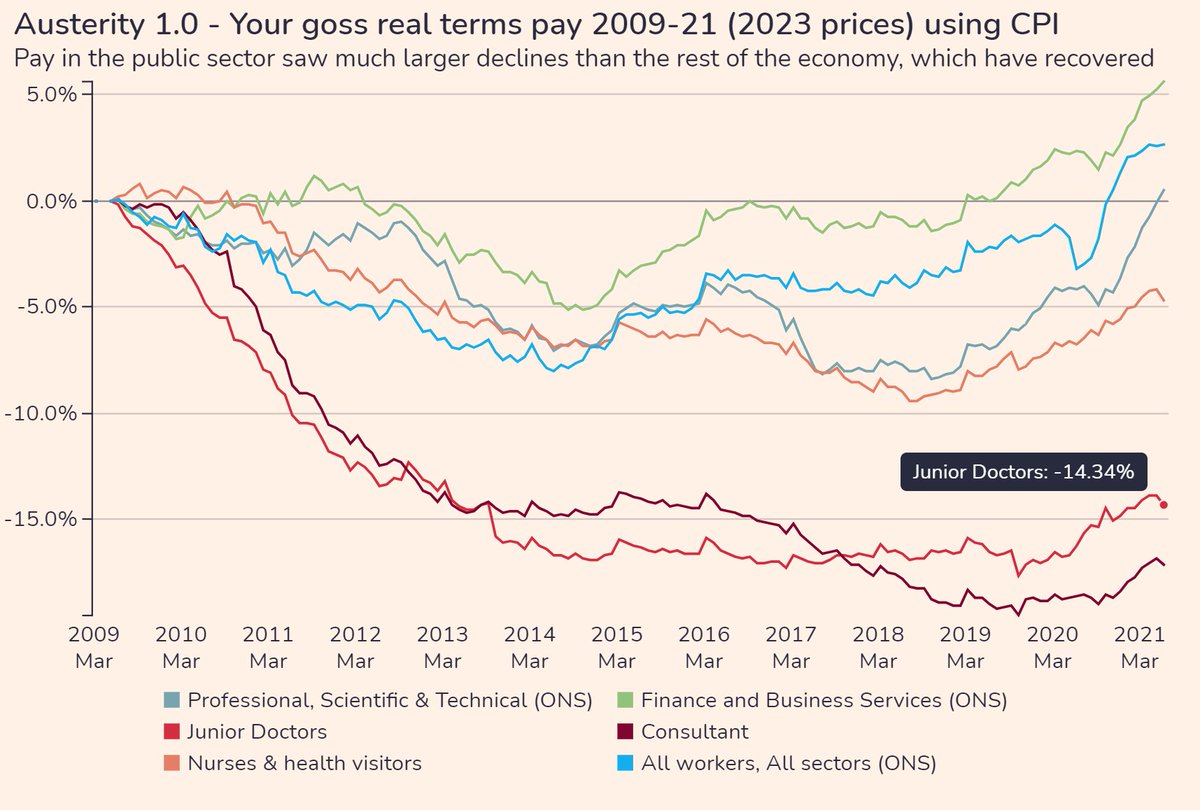
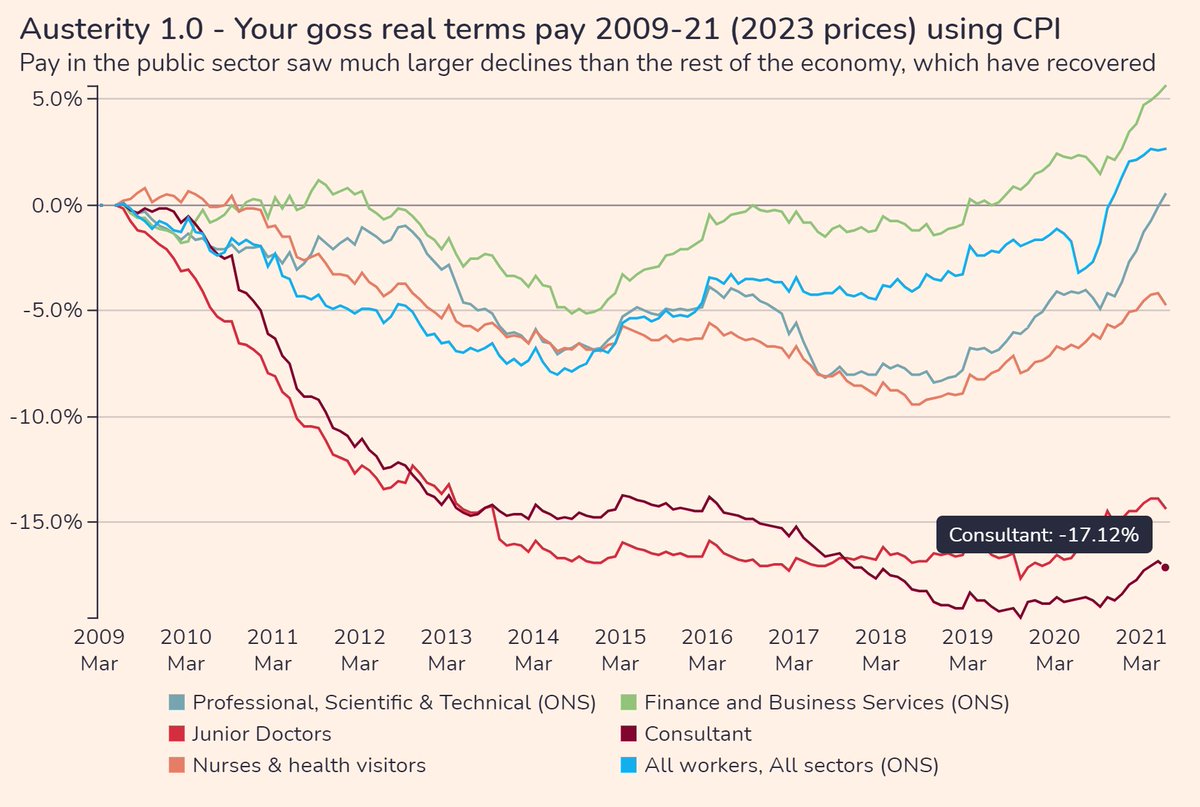
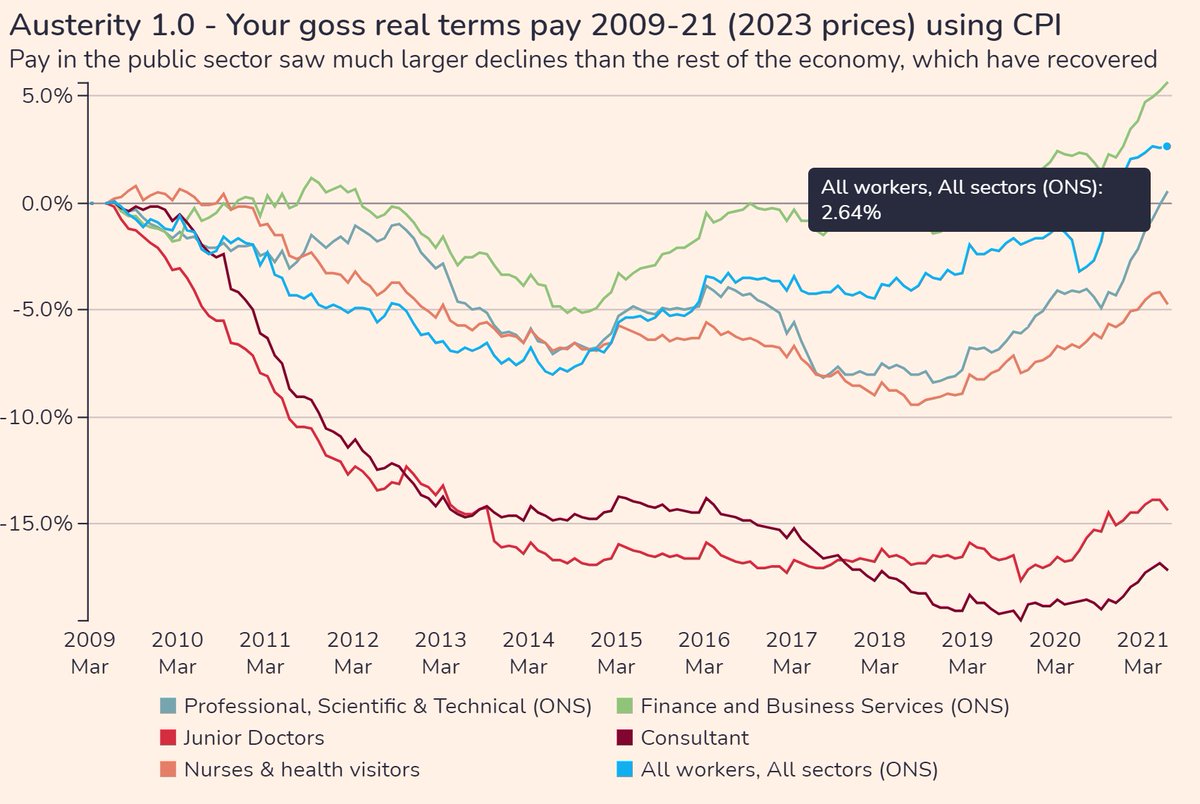
3/ Note in the same period of Austerity 1.0 (2009-21) the rest of the economy did just fine - all sectors, all workers (per ONS) up 2.6%, business & finance* up over 5% (* the ones who "caused" the crash)
4/ So now lets have a quick look at what going on in 21-24 - the period where have seen high inflation.
So called "junior" doctors
There were digracefully given 2% in the first 2 years of that period despite rampant inflation. Their pay fell massively behind.
So called "junior" doctors
There were digracefully given 2% in the first 2 years of that period despite rampant inflation. Their pay fell massively behind.

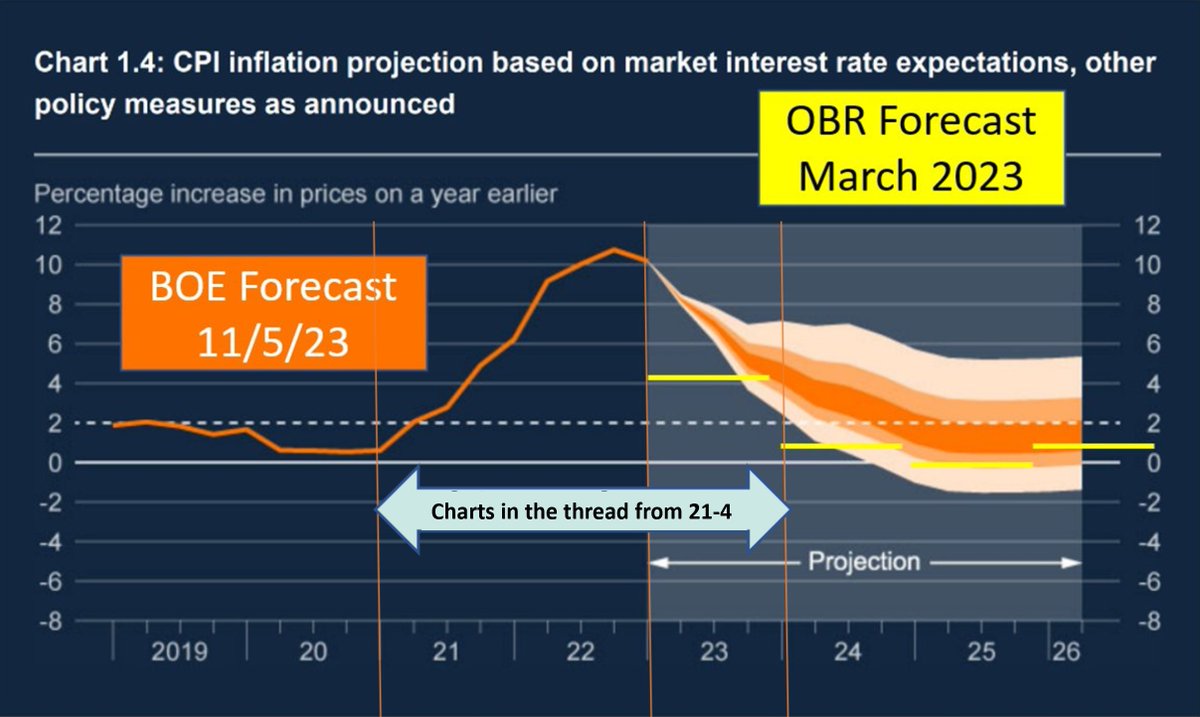
5/ Its crucially important to remember headline inflation (top) may be coming down but prices (bottom) CONTINUE to rise, just more slowly.
So each subinflation consolidated pay award projects into next years pay loss (and non-consolidated is lost forever once spent)
So each subinflation consolidated pay award projects into next years pay loss (and non-consolidated is lost forever once spent)

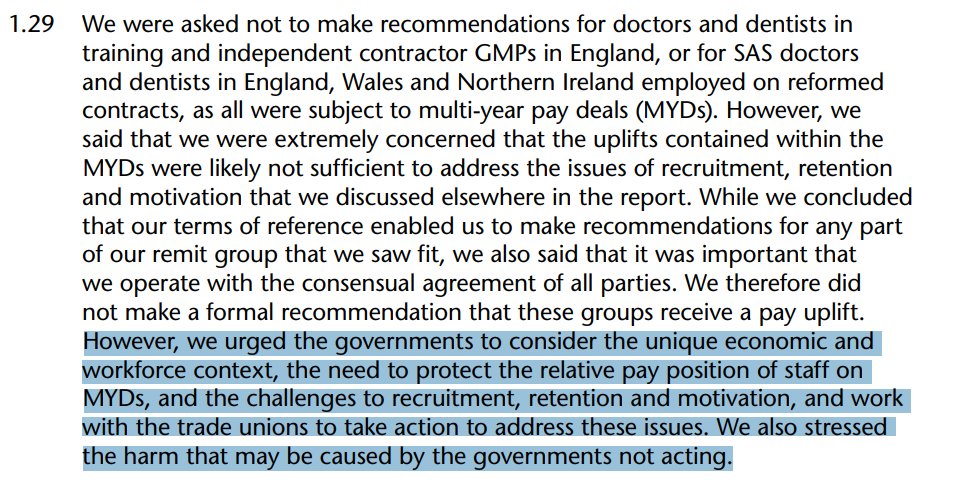
6/ Even the (not so independent, and somewhat corrupted) DDRB had to call out the governemnt for not acting on this in 22/23 & "need to protect the relative pay position of staff on MYDs...We also stressed the harm that may be caused by the governments not acting"
Gvmnt ignored
Gvmnt ignored
7/ So coming to the 23/24 award accepted by gvmnt for "juniors". Its 6% plus a fixed consolidated £1250 - amounts to an average about 8.9% (10.3% F1 orange-8,1% ST6-8 red)
Over 3 years the average pay award is a whole (and disgusting) 7.7% below what 🏴gov offered their juniors
Over 3 years the average pay award is a whole (and disgusting) 7.7% below what 🏴gov offered their juniors
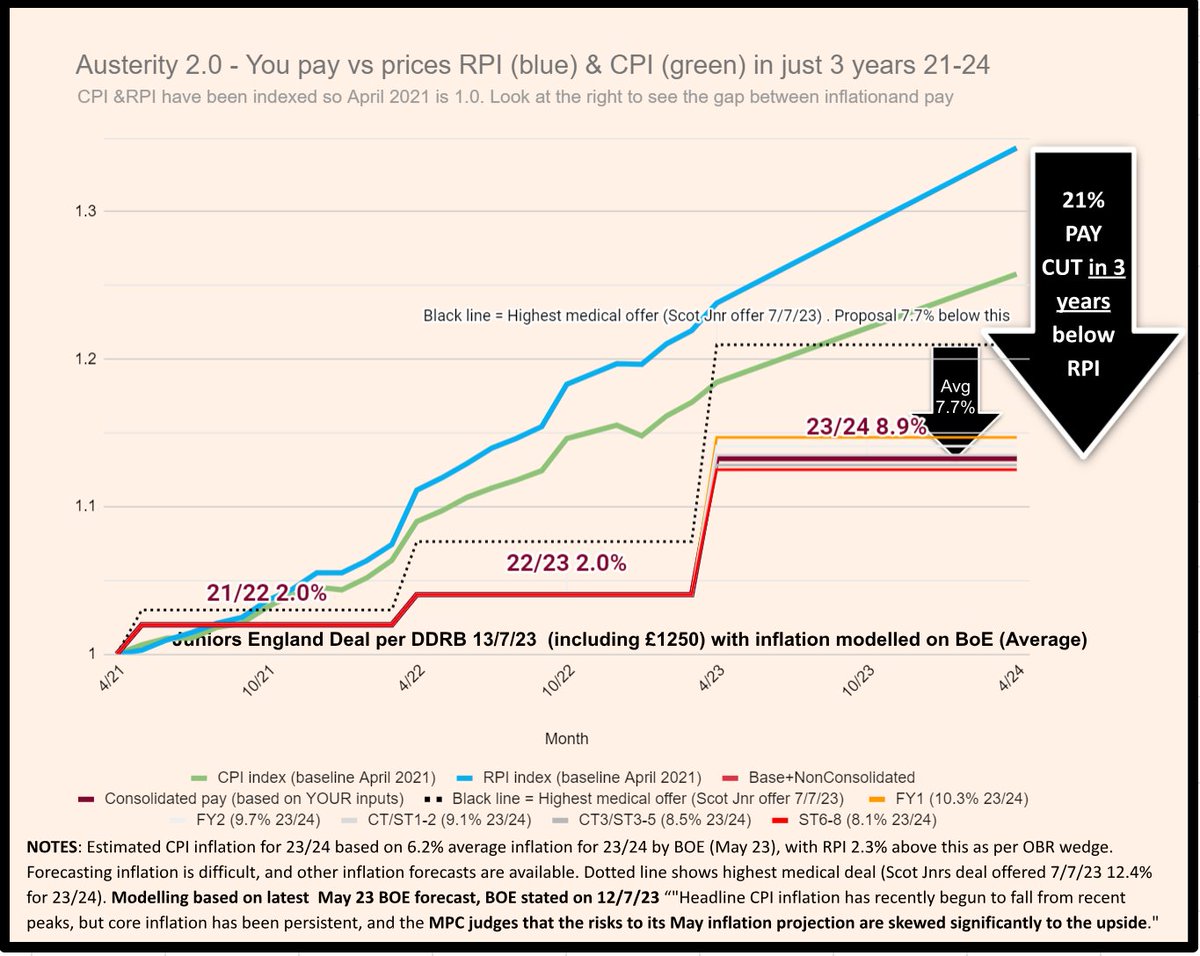
8/ Forecasting inflation is difficult. Indeed @patcullen9 @theRCN implying yesterday she was somewhat undersold by "ministers" said what inflation would be. The BOE forecasts (May) are now very singificantly higher than the OBR forecasts (Mar), and inflation still proving sticky
9/ Whichever measures of inflation you use (and lots of justification for using RPI including goverments use of them for student loans, & including mortgage interest costs etc, albeit RPI is far from perfect) the juniors offer leaves them WELL below inflation & WELL below 🏴👇
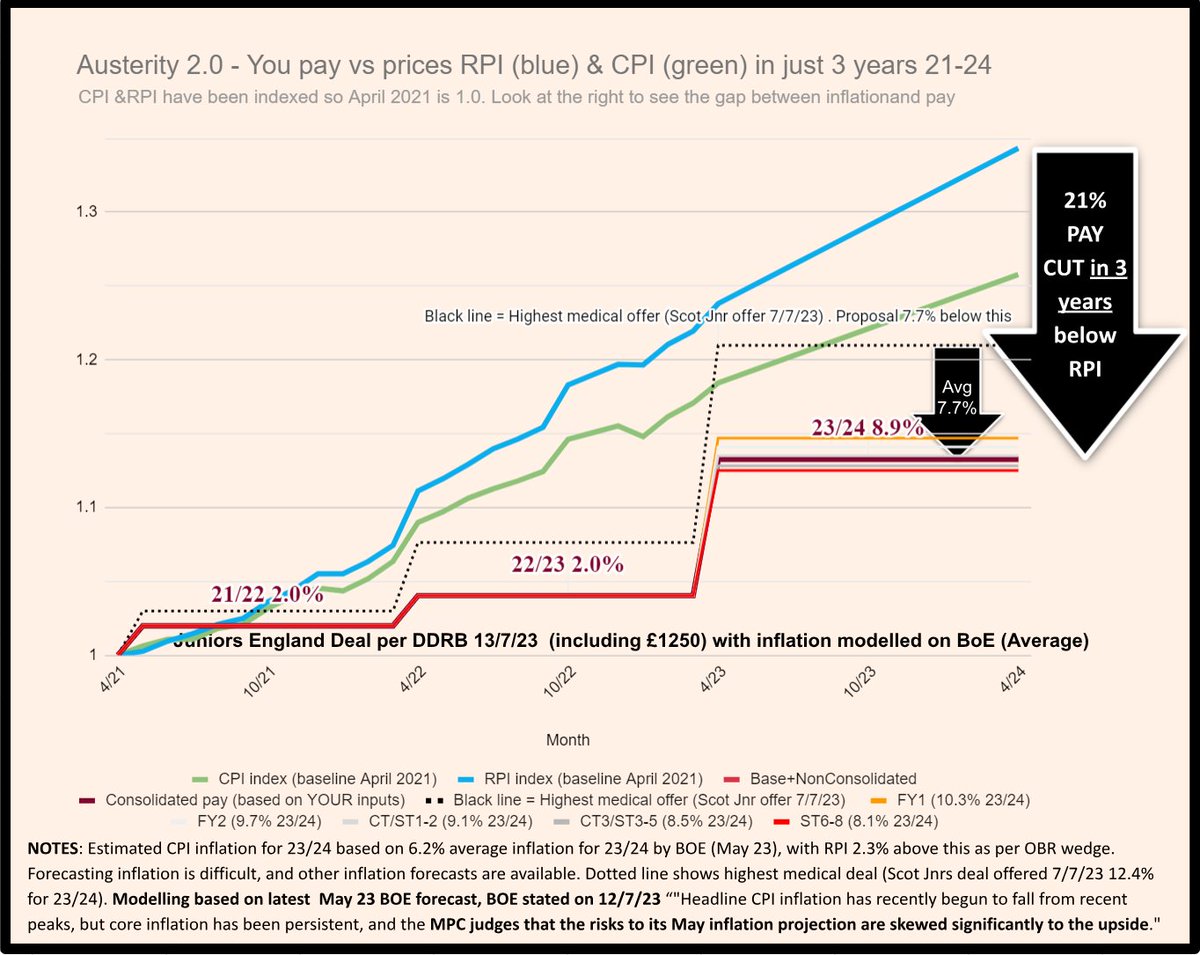
10/ Simply not good enough to leave "juniors" at the end of this *THREE YEAR* period some 21% down versus inflation (based on RPI)
Many of them already voting with their feet. We need them in the UK for the NHS of the future, but we need to respect & pay them properly #RETENTION
Many of them already voting with their feet. We need them in the UK for the NHS of the future, but we need to respect & pay them properly #RETENTION

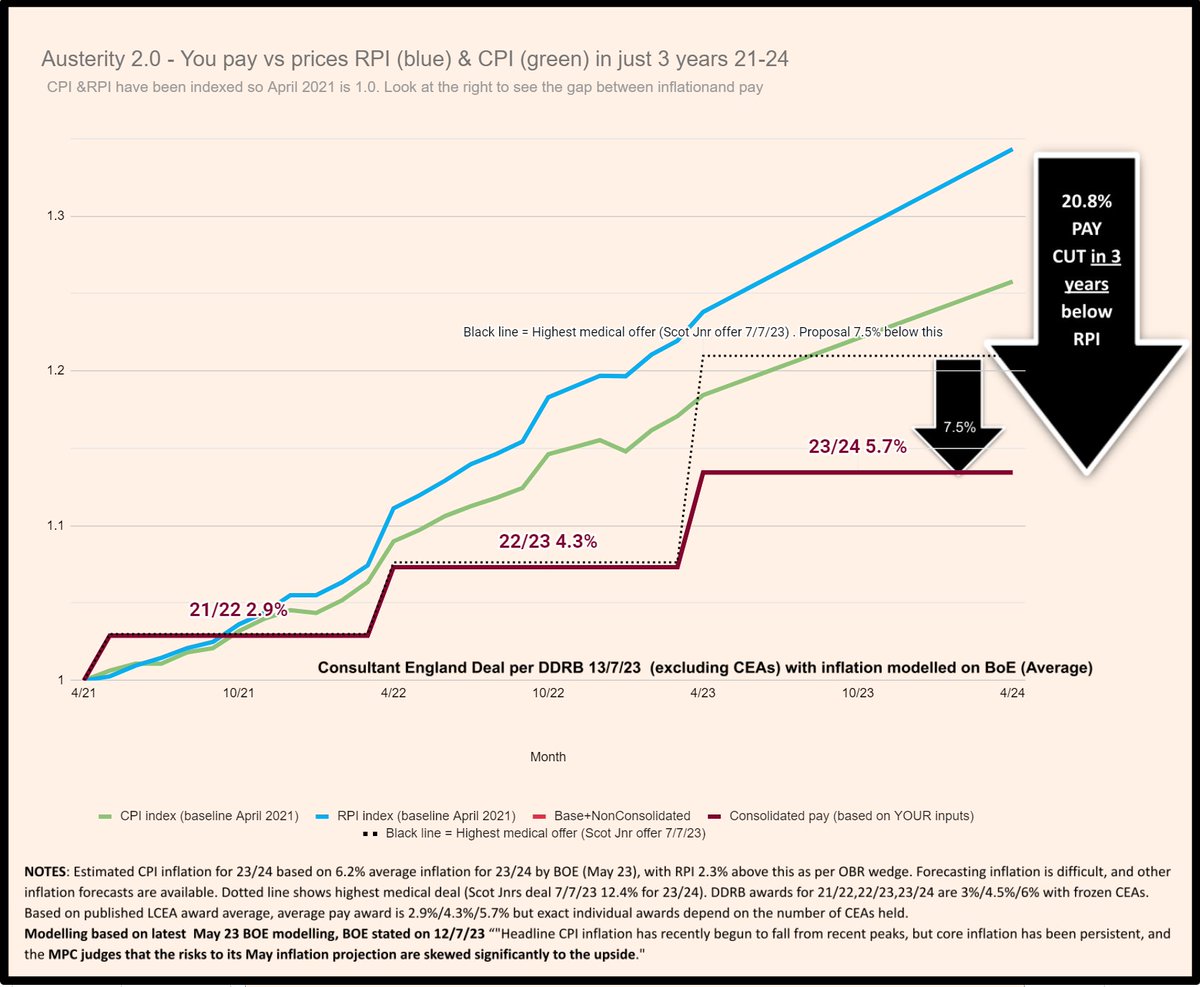
11/ Moving to @BMA_Consultants. DDRB say 6% but again freezing CEAs so maybe 5.7% on average, making the same 3 year period 2.9% / 4.3% / 5.7%
Some 7.5% below the 🏴junior offer as a public sector comparator.
And again hugely down vs whichever measure of inflation you choose.
Some 7.5% below the 🏴junior offer as a public sector comparator.
And again hugely down vs whichever measure of inflation you choose.
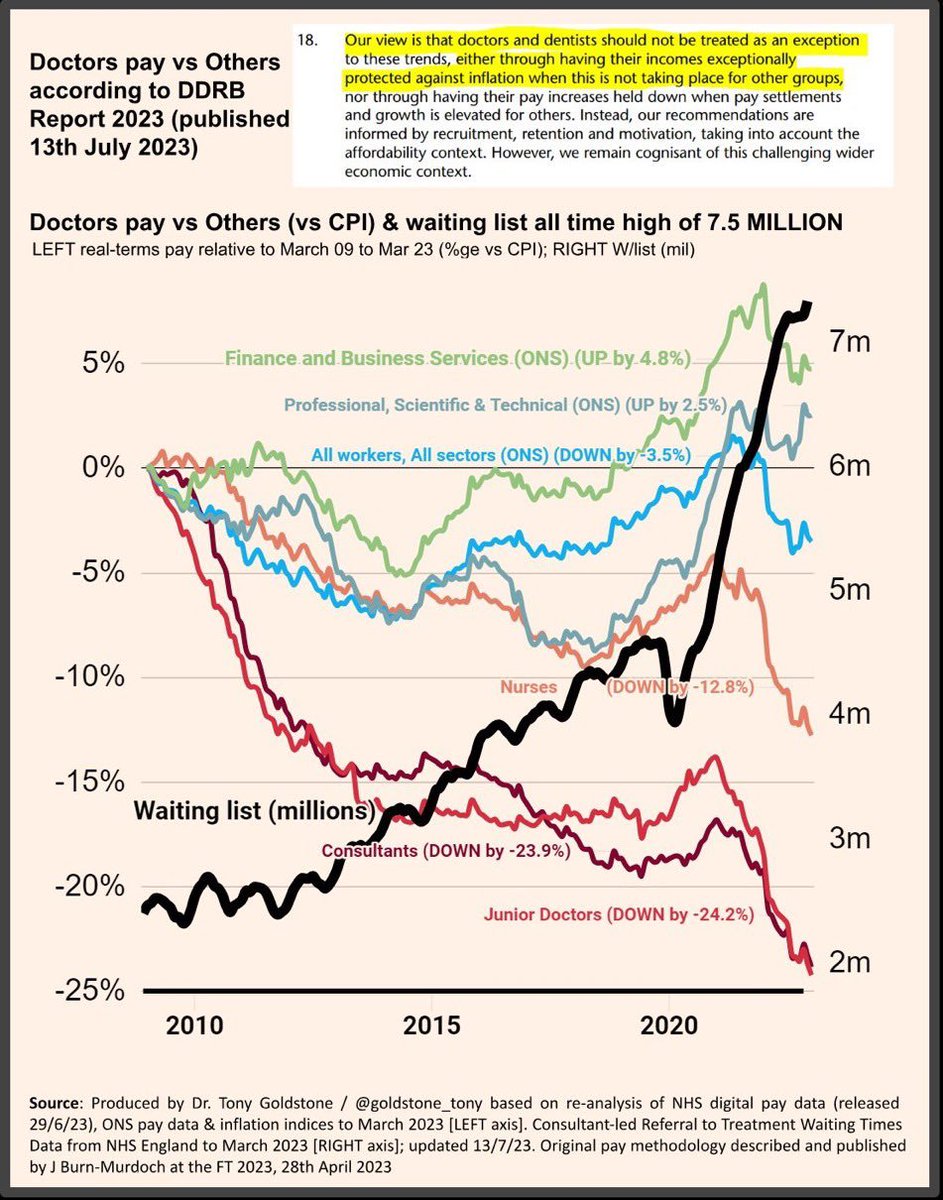
12/ The DDRB (and government) are trying to paint a false narrative
"doctors and dentists should not be treated as an exception to these trends, either through having their incomes exceptionally protected against inflation when this is NOT TAKING PLACE for other groups"👇
"doctors and dentists should not be treated as an exception to these trends, either through having their incomes exceptionally protected against inflation when this is NOT TAKING PLACE for other groups"👇

13/ But that narrative, is I am afraid a barefaced lie.
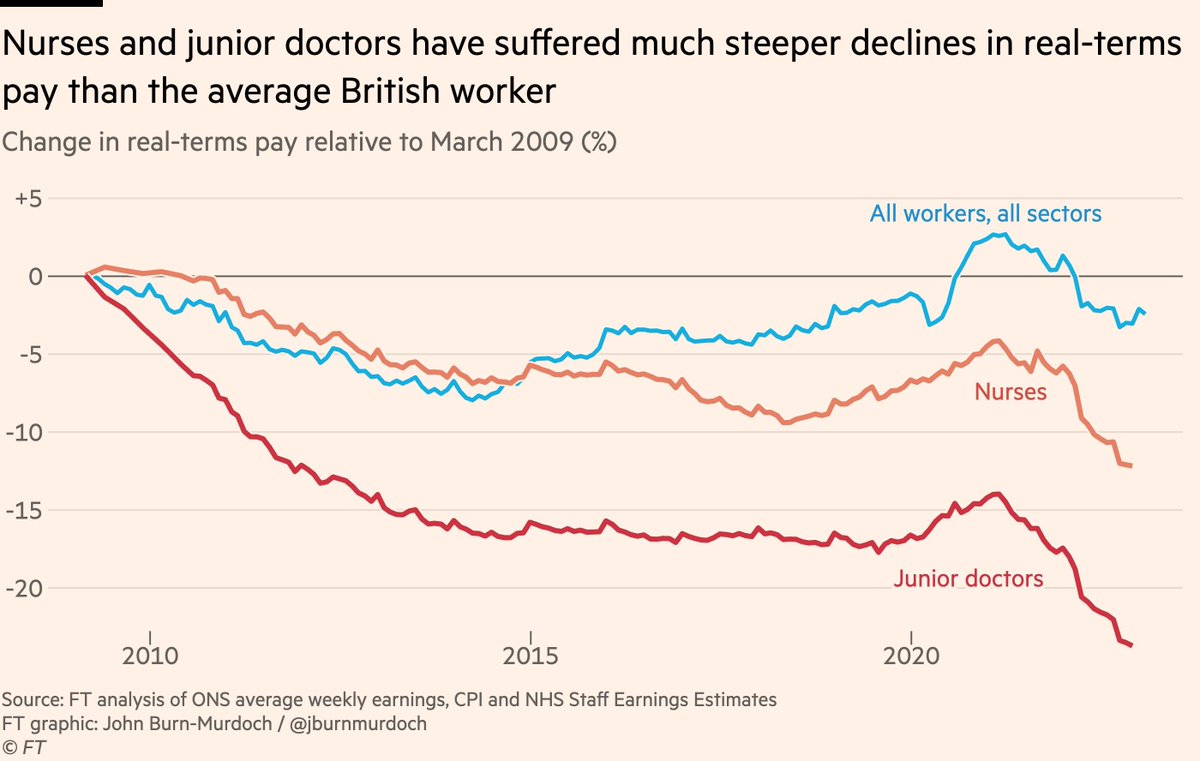
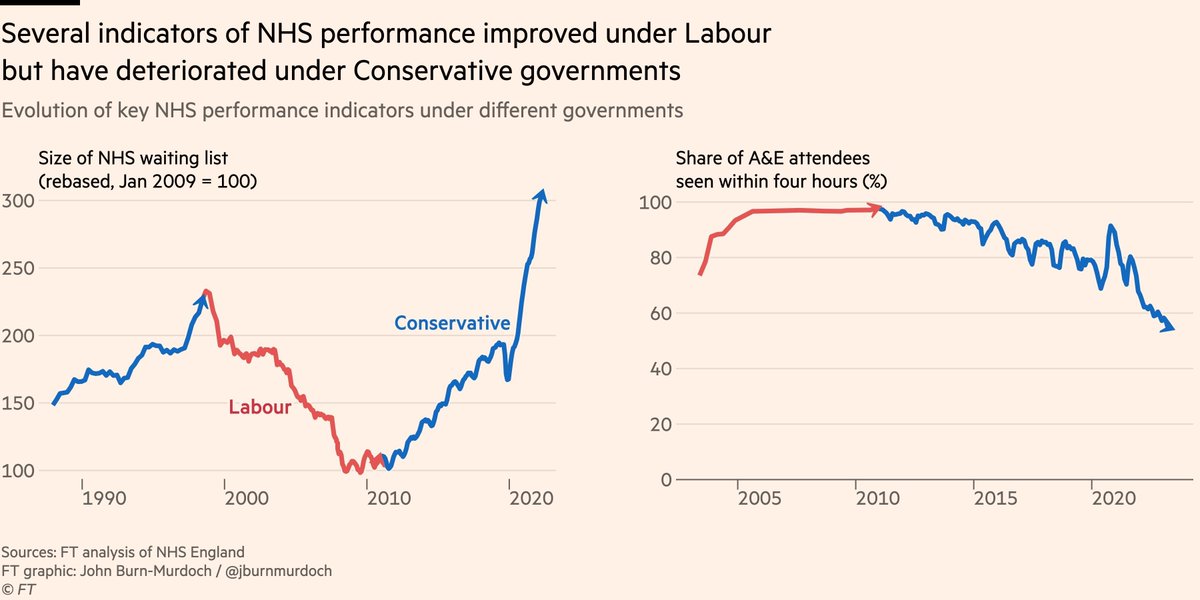
Take whichever graphs you like (left mine based on @FT methodology to Mar 23); right the birlliant @jburnmurdoch @FT to Dec 22). The conclusion is simple.... we are *NOT* all in this together
Take whichever graphs you like (left mine based on @FT methodology to Mar 23); right the birlliant @jburnmurdoch @FT to Dec 22). The conclusion is simple.... we are *NOT* all in this together


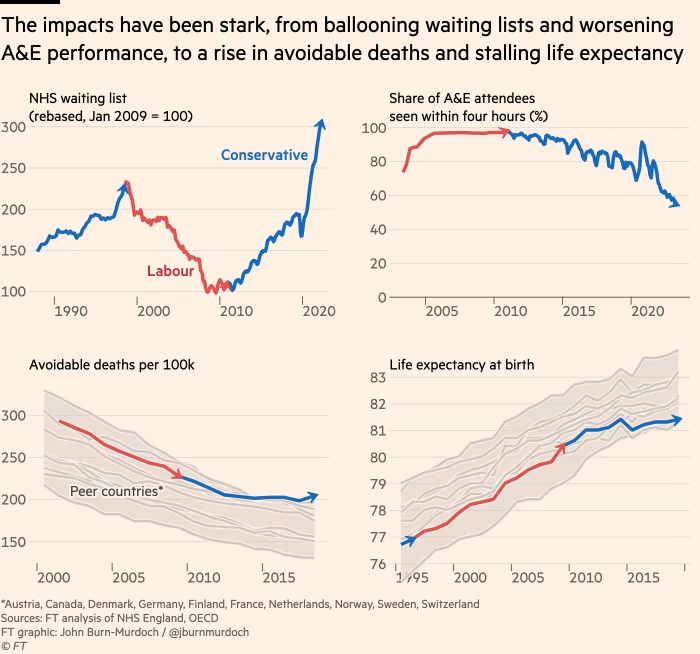
14/ NHS pay is essentially a political choice (which most economists agree does not impact inflation)
And it is one with serious consequences👇
And past performance does not guarantee future performance, so both @UKLabour @Conservatives need to step up & talk about pay openly
And it is one with serious consequences👇
And past performance does not guarantee future performance, so both @UKLabour @Conservatives need to step up & talk about pay openly
15/ Their have been HUGE difference in pay in the NHS versus the whole population and indeed comparable such as the ONS Professional Sci & Tech
16/ We need to have honest conversations about these graphs if current or any future government is serious about #RETENTION in the NHS.
The #nhsworkforceplan CANNOT and WILL NOT work without #RETENTION
The #nhsworkforceplan CANNOT and WILL NOT work without #RETENTION
17/ If the DDRB & government of the day were being HONEST they would describe these graphs as follows
"DDRB & governemnt have exceptionally destroyed NHS pay against inflation when this was broadly protected in other groups"
RT if you have had enough & support #PayRestoration
"DDRB & governemnt have exceptionally destroyed NHS pay against inflation when this was broadly protected in other groups"
RT if you have had enough & support #PayRestoration

• • •
Missing some Tweet in this thread? You can try to
force a refresh